Archive:Overview of status and progress of EU Member States towards the SDGs
Data extracted in May 2021.
Planned article update: 23 May 2022.
Highlights
This article is a part of a set of statistical articles, which are based on the Eurostat publication ’Sustainable development in the European Union — Monitoring report on progress towards the SDGS in an EU context — 2021 edition’. This report is the fifth edition of Eurostat’s series of monitoring reports on sustainable development, which provide a quantitative assessment of progress of the EU towards the SDGs in an EU context.
This article presents a statistical overview of the status and progress of EU Member States towards the 17 SDGs, based on the EU SDG indicator set. The status of each SDG in a Member State is an aggregation of all the indicators of a specific goal relative to the other Member States and the EU average. The progress score of the Member State is based on the average annual growth rates of all assessed indicators in the SDG over the past five years. The same approach towards aggregating individual indicator trends into a synthesised index per SDG is used in the synopsis article for the EU.
Such a synthesised presentation allows for a quick and easy overview and facilitates communication. However, applied to individual Member States, it entails the risk of simplification and might obscure details about underlying phenomena. Moreover, it has to be kept in mind that a country’s status depends to a certain extent on its natural conditions and historical developments. Therefore, users are invited to read the more detailed information at indicator level in the articles 1 to 17 on each SDG. Detailed data for the EU SDG indicators on a country level are also available on the Eurostat website.
Full article
How is the status and progress assessed?
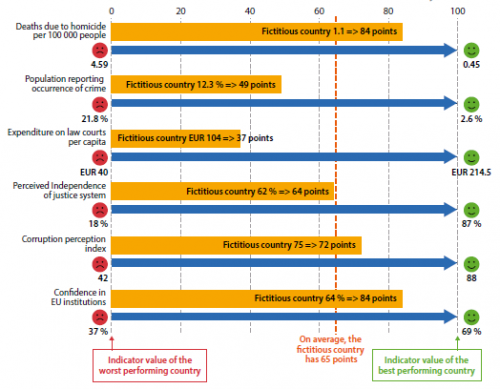
The status of a specific SDG is an aggregate score encompassing all of that goal’s indicators [1], based on the most recent data (mainly referring to 2019 and 2020). For each indicator, a country’s status score is calculated relative to the range of values from the worst to the best performing country, whereby outliers are excluded [2]. Figure 1 presents an example of the calculation of the status score for SDG 16. For each country, the resulting status score at SDG level is then put in relation to the EU aggregate status score of this goal, to show how much (in %) a country’s SDG status is above or below the EU average.
Progress is an aggregate score of the short-term (five-year) growth rates for all of the indicators assessed for each goal. The methodology uses a scoring function and is identical to the calculation of progress at EU level as presented in the introduction(also see Annex III available in paper format and as a downloadable (PDF file) for more details on the calculation method). Please note that the progress score calculation does not take into account any target values, since most EU policy targets are only valid for the aggregate EU level. Data mainly refer to the periods 2014-2019 or 2015-2020. Due to data availability issues, not all 17 SDGs are shown for each country.
A country’s status score is a relative measure, showing its position in relation to other Member States and the EU average. A high status consequently does not mean that a country is close to reaching a specific SDG, but that it has achieved a higher status than many other Member States. On the other hand, a country’s progress score is an absolute measure based on the indicator trends over the past five years, and its calculation is not influenced by the progress achieved by other Member States.
How to interpret the graphs?
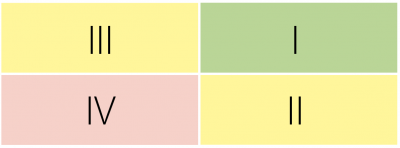
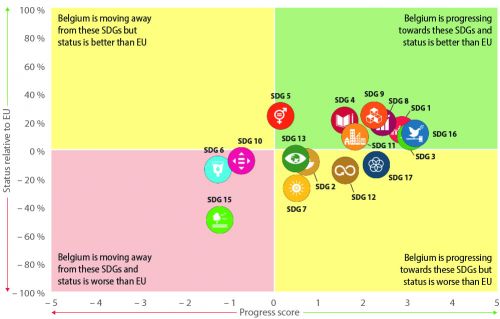
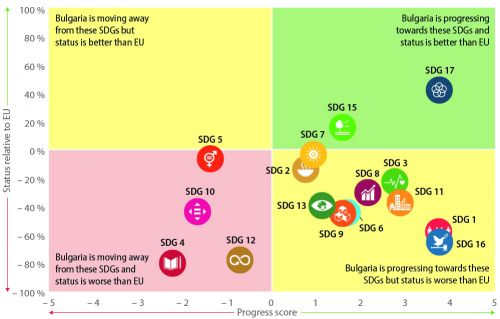
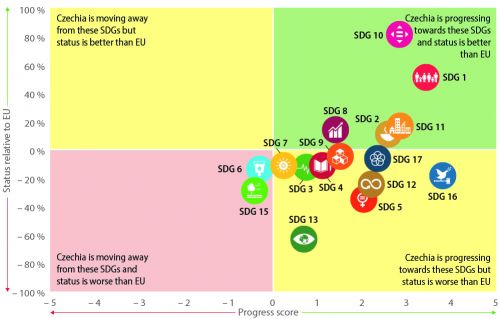
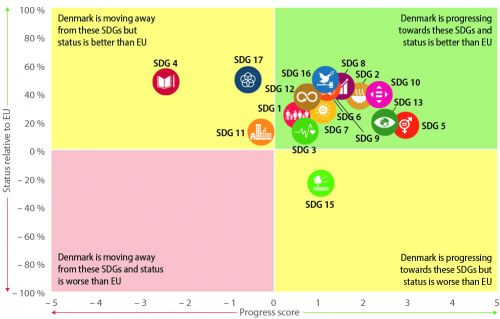
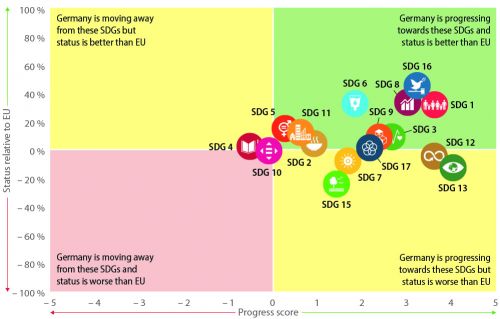
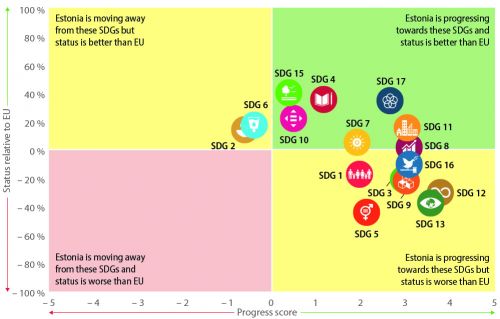
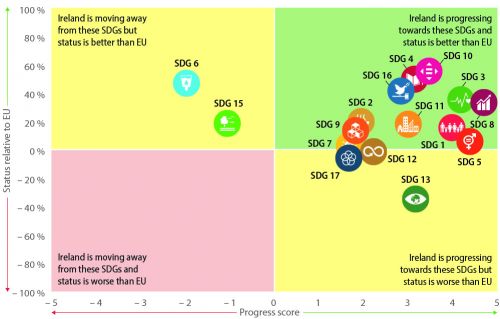
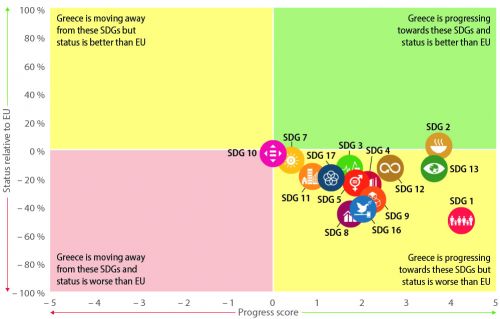
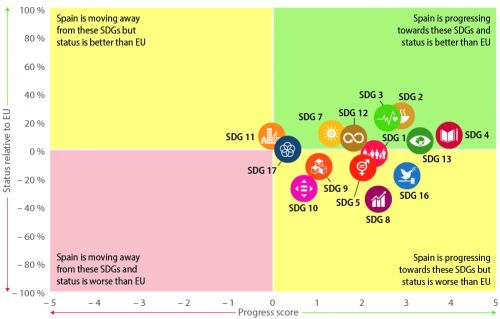
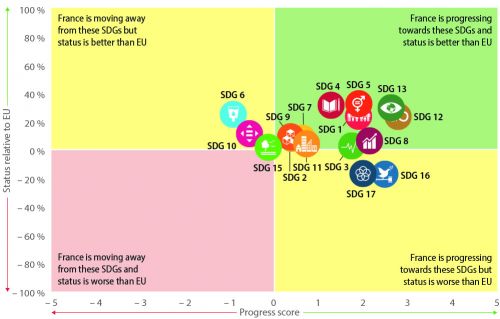
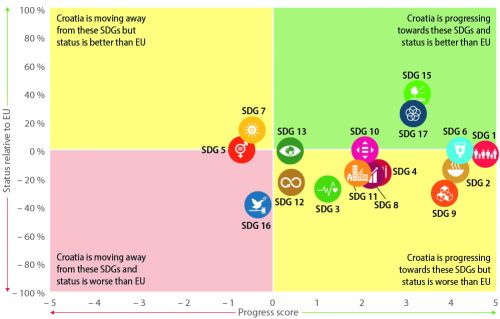
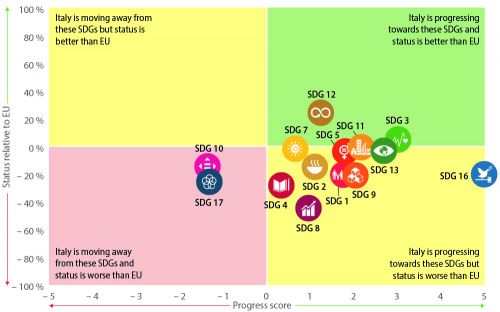
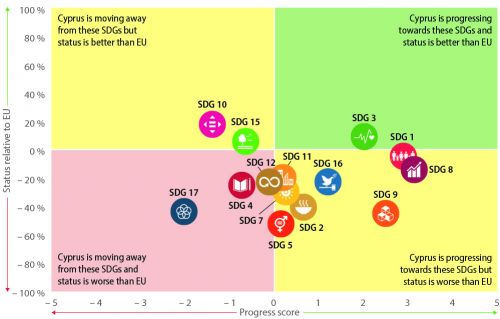
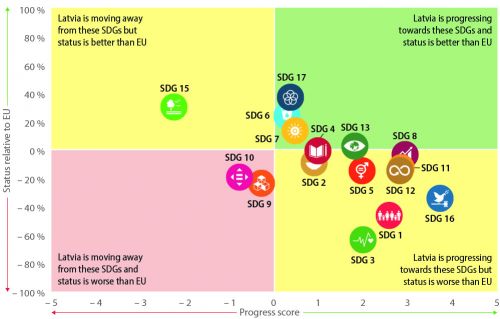
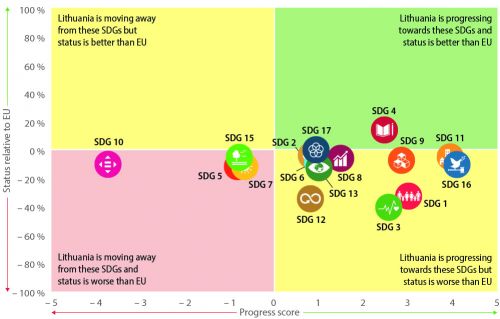
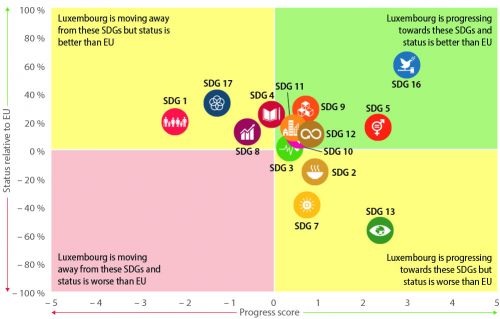
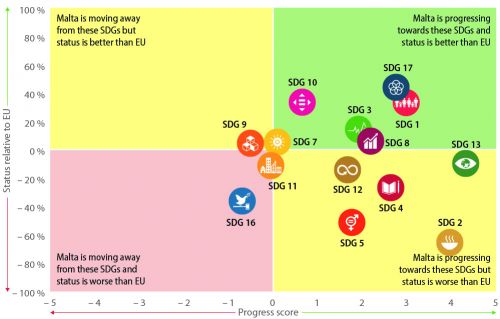
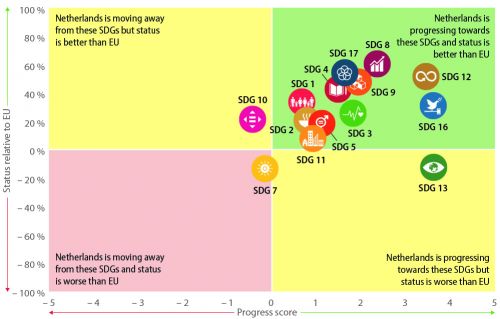
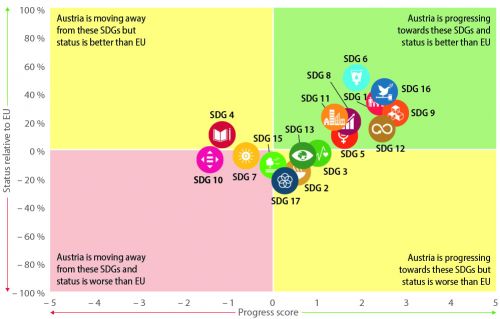
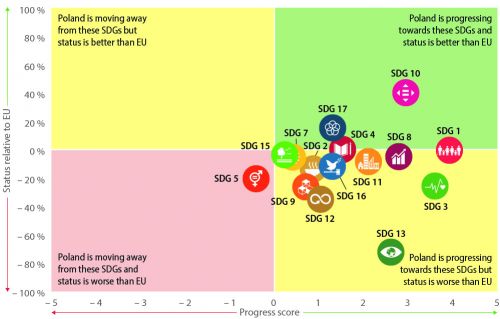
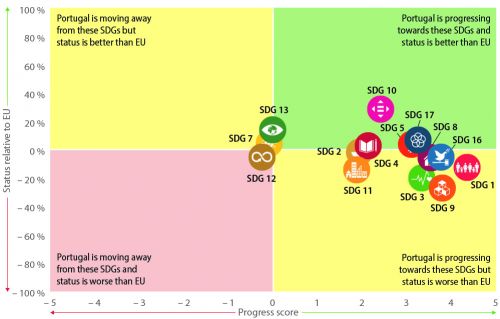
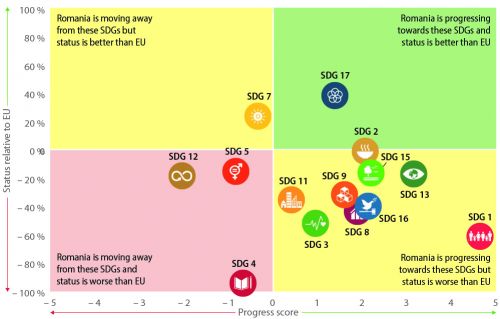
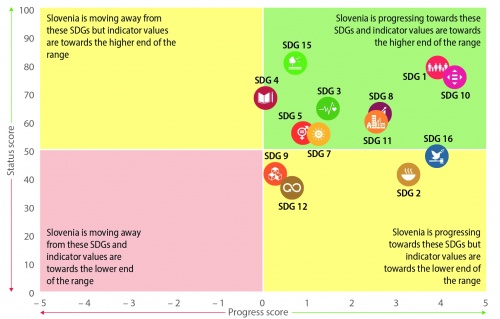
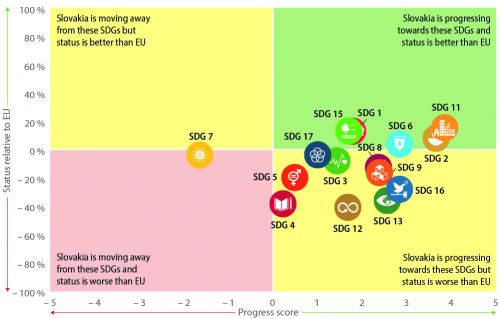
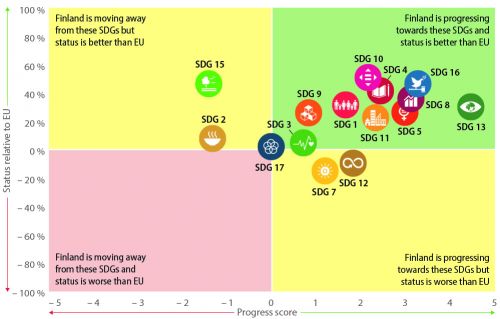
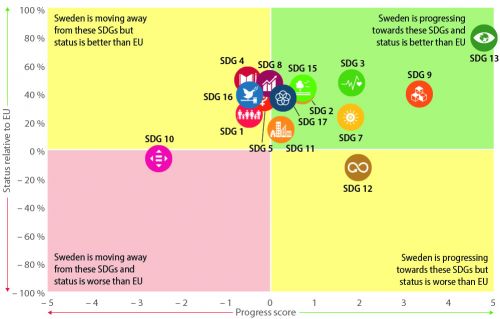
The vertical axis shows the status of SDGs in the depicted country within the distribution of Member States and relative to the EU average. SDGs in the upper part of the graph have a status above the EU average, and for SDGs in the lower part the status is below the EU average. The right side of the graph displays SDGs where the country has made progress whereas the left side indicates movements away from the SDGs. This results in four “quadrants” which can be characterised as follows:
I. The country is progressing towards these SDGs, and on average the indicator values are above the EU average.
II. The country is progressing towards these SDGs, but on average the indicator values are below the EU average.
III. The country is moving away from these SDGs, but on average the indicator values are above the EU average.
IV. The country is moving away from these SDGs, and on average the indicator values are below the EU average.
Presentation of Member States’ status and progress
Belgium
Bulgaria
Czechia
Denmark
Germany
Estonia
Ireland
Greece
Spain
France
Croatia
Italy
Cyprus
Latvia
Lithuania
Luxembourg
Hungary
Malta
Netherlands
Austria
Poland
Portugal
Romania
Slovenia
Slovakia
Finland
Sweden
Direct access to
Notes
- ↑ The (comparative) status is a composite index based on the relative indicator values so for each indicator in the goal, the worst country value corresponds to 0 points and the best to 100 points. During the indexing at indicator level, outliers are excluded (see next footnote) and are manually assigned an index value of 0 or 100 (depending on which end of the distribution an outlier is situated). The country status is then the average points across all indicators.
- ↑ Outliers are identified by means of the interquartile range (IQR) method (see Hoaglin, D. C., Iglewicz, B., & Tukey, J. W. (1986), Performance of Some Resistant Rules for Outlier Labeling, Journal of the American Statistical Association, 81(396), 991-999 and Hoaglin, D. C., & Iglewicz, B. (1987), Fine-Tuning Some Resistant Rules for Outlier Labeling, Journal of the American Statistical Association, 82(400), 1147-1149). This method involves calculating the first and third quartiles of the country distribution, with the IQR representing the difference between these two values. The boundaries for identifying outliers are then determined by multiplying the IQR by the factor two and by subtracting/adding these values from/to the first/third quartile, respectively. Values below/above these thresholds are considered outliers and are excluded during indexing, meaning that countries identified as outliers with this method are assigned the value of the next best/worst country for the indexing.
