._Investment_rate,_EU-27,_2006_(%25).PNG)
. Investment rate, EU-27, 2006 (%).PNG&body=Statistics Explained - Accommodation and food services (NACE Section H). Investment rate, EU-27, 2006 (%).PNG %0A https%3A%2F%2Fec.europa.eu%2Feurostat%2Fstatistics-explained%2Findex.php%3Ftitle%3DFile%3AAccommodation_and_food_services_%28NACE_Section_H%29._Investment_rate%2C_EU-27%2C_2006_%28%2525%29.PNG)
File:Accommodation and food services (NACE Section H). Investment rate, EU-27, 2006 (%).PNG
Revision as of 14:43, 28 April 2011 by Verdodo (talk | contribs) (→Table created with data from January 2009)
._Investment_rate,_EU-27,_2006_(%25).PNG&diff=prev&oldid=56305)
._Investment_rate,_EU-27,_2006_(%25).PNG&direction=prev&oldid=56305)
No higher resolution available.
Accommodation_and_food_services_(NACE_Section_H)._Investment_rate,_EU-27,_2006_(%).PNG (445 × 502 pixels, file size: 15 KB, MIME type: image/png)
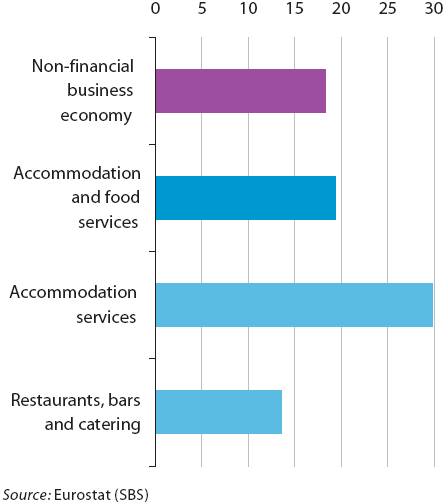
Accommodation and food services (NACE Section H). Investment rate, EU-27, 2006
- (%)
Figure created with data from January 2009
File usage
The following page uses this file:
._Investment_rate,_EU-27,_2006_(%25).PNG&oldid=56305)
._Investment_rate,_EU-27,_2006_(%25).PNG)
._Investment_rate,_EU-27,_2006_(%25).PNG&action=edit&redlink=1)
._Investment_rate,_EU-27,_2006_(%25).PNG&action=history)