EU international trade in other business services
Data extracted in February 2024.
Planned article update: March 2025.
Highlights
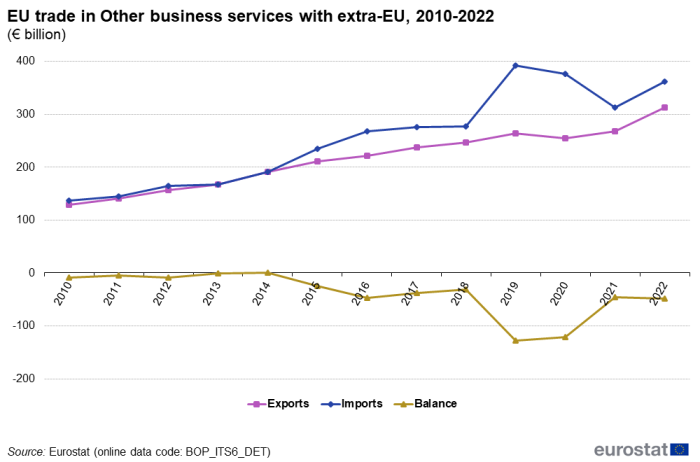
EU trade in Other business services with extra-EU, 2010-2022
The role of trade in services in EU international trade has been growing steadily over the last decade and plays a major role in modern economies in an increasingly interlinked and globalised world. International trade in services (see Context) flows show the transactions between residents and non-residents according to twelve main service categories of the Extended Balance of Payments Services classification (EBOPS 2010). 'Other business services' is the largest of the twelve service categories, accounting for 23.0 % of total services exports to extra-EU and 31.3 % of total services imports from non-EU countries in 2022. The second largest category is 'Transport services', presented in a separate article.
This article focuses on the structure and evolution of the EU's international trade in 'Other business services' with extra-EU countries. The 'Other business services' category contains three sub-categories[1], namely: 'Research and development (R&D) services', 'Professional and management consulting services', and 'Technical, trade-related and other business services'. These sub-categories are presented in this article.
Full article
General overview
Figure 1 shows the evolution of the time series for 'Other business services' from 2010 to 2022. EU imports of 'Other business services' have been higher than exports for all years in the period 2010 to 2022 except in 2014. This resulted in a consistent negative balance in all years except 2014. From 2010 until 2019, imports of 'Other business services' have been constantly increasing with the largest increase recorded in 2019 (41.5 %). During the same period, exports have also been constantly increasing, but at a more modest rate. In 2020 however, imports and exports have decreased by 4.2 % and 3.4 % respectively. In 2021 imports continued to decrease by 16.7 % while exports increased by 5.0 %. The trade rebounded in 2022 with an increase of 15.4 % for imports and 16.9 % for exports, the largest increase ever recorded for exports.
Source: Eurostat (bop_its6_det)
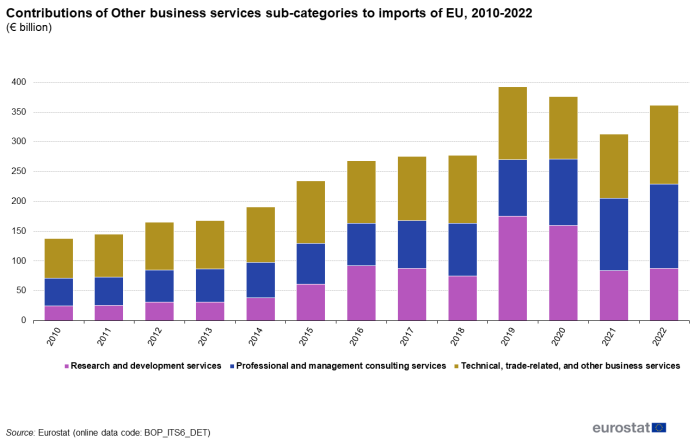
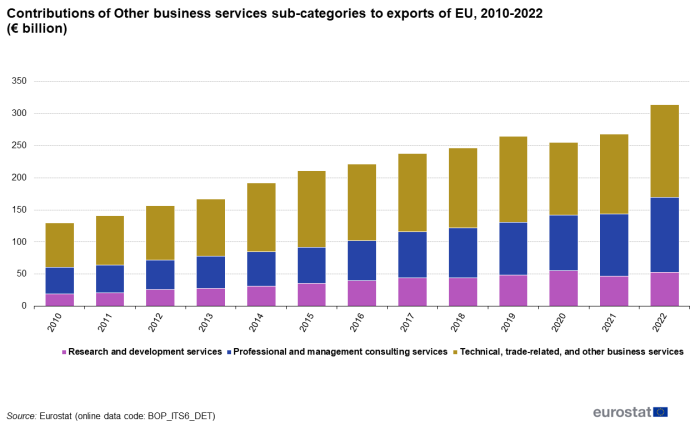
Figure 2 and Figure 3 show the contributions of the three sub-categories of 'Other business services' to imports and exports for 2010-2022. Until 2018 the largest contributor to imports was the sub-category of 'Technical, trade-related and other business services'. In 2019 and 2020 'R&D services' was the largest contributor to imports, and 'Professional and management consulting services' in 2021 and 2022. As regards exports, the sub-category of 'Technical, trade-related and other business services' is the largest contributor for the entire period 2010-2022.
Source: Eurostat (bop_its6_det)
Source: Eurostat (bop_its6_det)
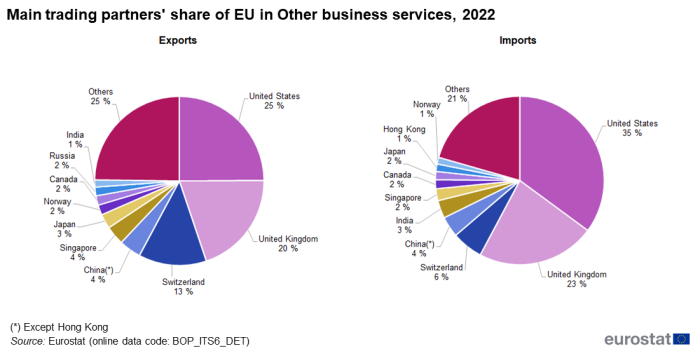
In 2022, the United States was the EU's main partner for imports and exports of 'Other business services' (35.1 % of imports and 24.9 % of exports). It was followed closely by the United Kingdom with 22.6 % of imports and 19.9 % of exports, and then by Switzerland with 6.0 % of imports and 13.0 % of exports (see Figure 4).
Source: Eurostat (bop_its6_det)
Research and development (R&D) services
'R&D services'[2] consist of services associated with basic research, applied research and experimental development of new products and processes.
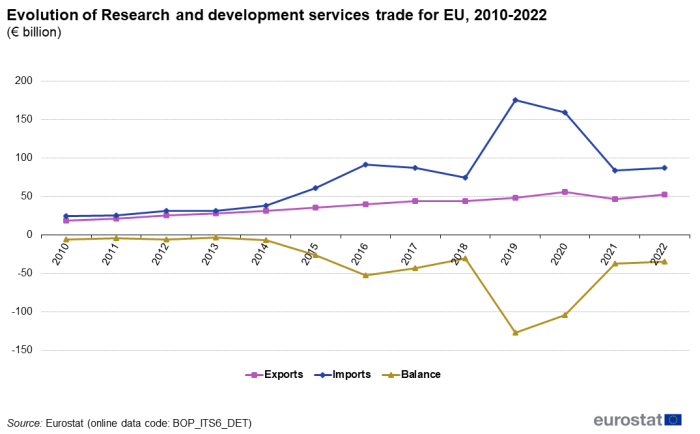
The evolution of 'R&D services' between 2010 and 2022 is shown in Figure 5. Imports were marginally higher than exports in the period 2010 to 2014. Imports then overtook exports with a large increase in 2015 and 2016, resulting in a large drop in the balance. The negative balance (deficit) slightly decreased in 2017 and 2018. However, in 2019 and 2020 imports increased significantly, resulting in a large increase in the deficit, as in the same period exports increased only marginally. In 2021 and 2022, both exports and imports dropped to levels comparable with those of 2018.
Source: Eurostat (bop_its6_det)
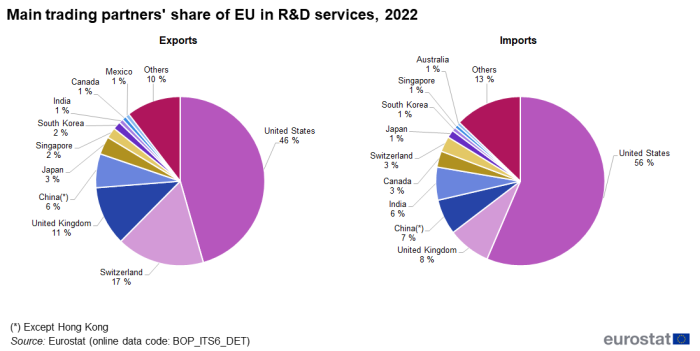
In 2022, the EU's largest trade partner for 'R&D services' was the United States, accounting for 56.4 % of the imports and 45.6 % of the exports. The United Kingdom came second for imports with 8.2 % followed by China with 6.7 %. Switzerland was the second largest partner for exports with 16.8 %, followed by the United Kingdom with 11.3 % (see Figure 6).
Source: Eurostat (bop_its6_det)
Professional and management consulting services
'Professional and management consulting services'[3] comprise:
(a) legal services, accounting, management consulting, managerial services and public relations services;
(b) advertising, market research and public opinion polling services.
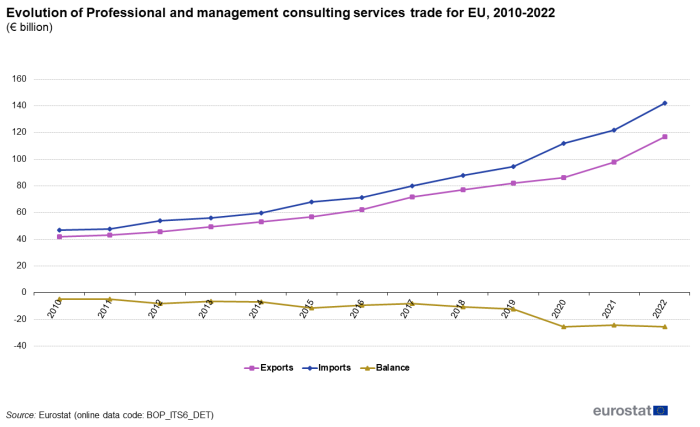
Imports of 'Professional and management consulting services' exceeded exports each year between 2010 and 2022, resulting in a deficit, as shown in Figure 7. From 2010 until 2022, both imports and exports continued increasing at a more or less constant, moderate rate. The peak increase was recorded in 2022 for exports (19.6 %) and in 2020 for imports (18.2 %).
Source: Eurostat (bop_its6_det)
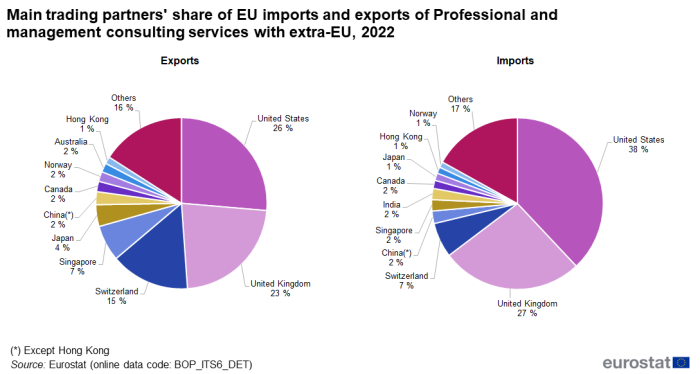
In 2022, the United States was the EU's largest trading partner for imports and exports of 'Professional and management consulting services' with 38.0 % of the imports and 26.4 % of the exports (see Figure 8). The United Kingdom came second with 26.7 % of the imports and 22.5 % of the exports while Switzerland was third with 6.6 % of the imports and 15.0 % of the exports.
Source: Eurostat (bop_its6_det)
'Technical, trade-related and other business services'[4] comprise:
- architectural, engineering and other technical services;
- waste treatment and environmental remediation, agricultural and mining services;
- operating leasing services, trade-related services;
- other business services such as:
- distribution services related to water, steam, gas and other petroleum products and the supply of air-conditioning, placement of personnel, security, photographic services, publishing, real estate, etc.
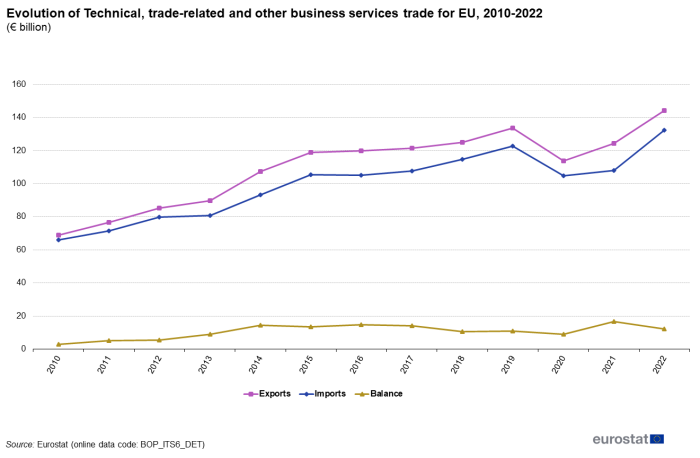
'Technical, trade-related and other business services' represent the largest subcategory of other business services. The evolution of 'Technical, trade-related and other business services' trade since 2010 is shown in Figure 9.
Exports of 'Technical, trade-related and other business services' continuously exceeded imports in the period 2010 to 2022, resulting in a positive balance. Both exports and imports increased or remained approximately stable in all years in the period 2010 to 2019. In 2020 exports dropped by 14.8 % and imports by 14.6 %. In 2021 exports increased by 9.2 % and imports by 2.8 % and respectively by 16.0 % and 22.6 % in 2022.
Source: Eurostat (bop_its6_det)
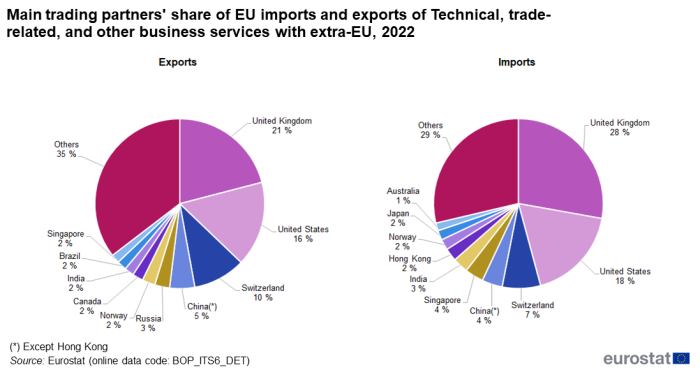
In 2022, the United Kingdom was the EU's largest trading partner for both imports and exports of 'Technical, trade-related and other business services' with 27.8 % of the imports and 21.0 % of the exports. The United States came second with 18.0 % of imports and 16.2 % of exports while Switzerland was third with 7.3 % of the imports and 10.0 % of exports (see Figure 10).
Source: Eurostat (bop_its6_det)
Source data for tables and graphs
Data sources
EU data on trade in other business services come from the Eurostat reference database on International Trade in Services and are prepared in accordance with BPM6, the current balance of payments methodology. The data are updated annually. They have been available since 2010 for EU aggregates, all EU Member States and non-EU countries (European Free Trade Association (EFTA), candidate countries and other countries). Pre-2010 data are also available in the Eurostat reference database but are prepared in accordance with the previous balance of payments methodology (BPM5).
Statistics on the EU's trade with the extra-EU are calculated as the sum of trade conducted by the 27 Member States and the EU institutions (except the European Central Bank and European Stability Mechanism) with the countries outside the EU (no flows within the EU are taken into account).
Context
International trade in services makes up part of the current account of the balance of payments and covers the transactions between the residents and non-residents of a country during a given period. International trade in services follows the BPM6 methodology, which uses 12 main service categories, one of which is 'Other business services'. EU trade in services with the extra-EU countries has been on an increasing trend from 2010 to 2021 for both imports and exports - with the exception of year 2020 when both exports and imports dropped as a result of the Covid-19 pandemic.Direct access to
- All articles on balance of payments
- Balance of payments and international investment position manual (BPM6)
- Measuring international trade in services - from BPM5 to BPM6
- Services trade by enterprise characteristics - STEC
- EU international trade in transport services
- International trade in services
- Services trade statistics by modes of supply
- International Trade in Services statistics - background
- Balance of payments - International transactions (BPM6) (ESMS metadata file — bop_6_esms)
- International trade in services, geographical breakdown (BPM6) (ESMS metadata file — bop_its6_esms)
- Regulation (EC) No 184/2005 of 12 January 2005 on Community statistics concerning balance of payments, international trade in services and foreign direct investment. (Summary)
- Regulation (EU) No 555/2012 of 22 June 2012 amending Regulation (EC) No 184/2005 on Community statistics concerning balance of payments, international trade in services and foreign direct investment, as regards the update of data requirements and definitions.
- Regulation (EU) No 2016/1013 of 8 June 2016 amending Regulation (EC) No 184/2005 on Community statistics concerning balance of payments, international trade in services and foreign direct investment.
- European Commission — Trade
- International Monetary Fund (IMF) — International Trade in Services: Recent Methodological Developments
- Newsletter of the Interagency Task Force on Statistics of International Trade in Services
- OECD — Services trade
- United Nations Conference on Trade and Development (UNCTAD) — Manual on Statistics of International Trade in Services 2010 (MSITS 2010)
Notes
- ↑ As defined by the Balance of Payments Manual 6 (BPM6) Chapter 10.147
- ↑ As defined by the Balance of Payments Manual 6 (BPM6) Chapter 10.147
- ↑ As defined by the Balance of Payments Manual 6 (BPM6) Chapter 10.149
- ↑ As defined by the Balance of Payments Manual 6 (BPM6) Chapter 10.151