File:Graph2-2009-2010 monthly growth of EU-27 passengers carried in the first six months of 2010.JPG
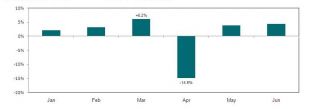
Revision as of 14:09, 20 April 2011 by EXT-M-Erzar (talk | contribs) (Graph 2: 2009/2010 monthly growth of EU-27 passengers carried in the first six months of 2010)

Size of this preview: 800 × 272 pixels. Other resolutions: 320 × 109 pixels | 859 × 292 pixels.
Original file (859 × 292 pixels, file size: 15 KB, MIME type: image/jpeg)
Graph 2: 2009/2010 monthly growth of EU-27 passengers carried in the first six months of 2010
File usage
There are no pages that use this file.