.png)
.png&body=Statistics Explained - Figure 1 Greenhouse gas emissions by economic activity, EU, 2010Q1 - 2021Q3 (million tonnes of CO2 equivalents).png %0A https%3A%2F%2Fec.europa.eu%2Feurostat%2Fstatistics-explained%2Findex.php%3Ftitle%3DFile%3AFigure_1_Greenhouse_gas_emissions_by_economic_activity%2C_EU%2C_2010Q1_-_2021Q3_%28million_tonnes_of_CO2_equivalents%29.png)
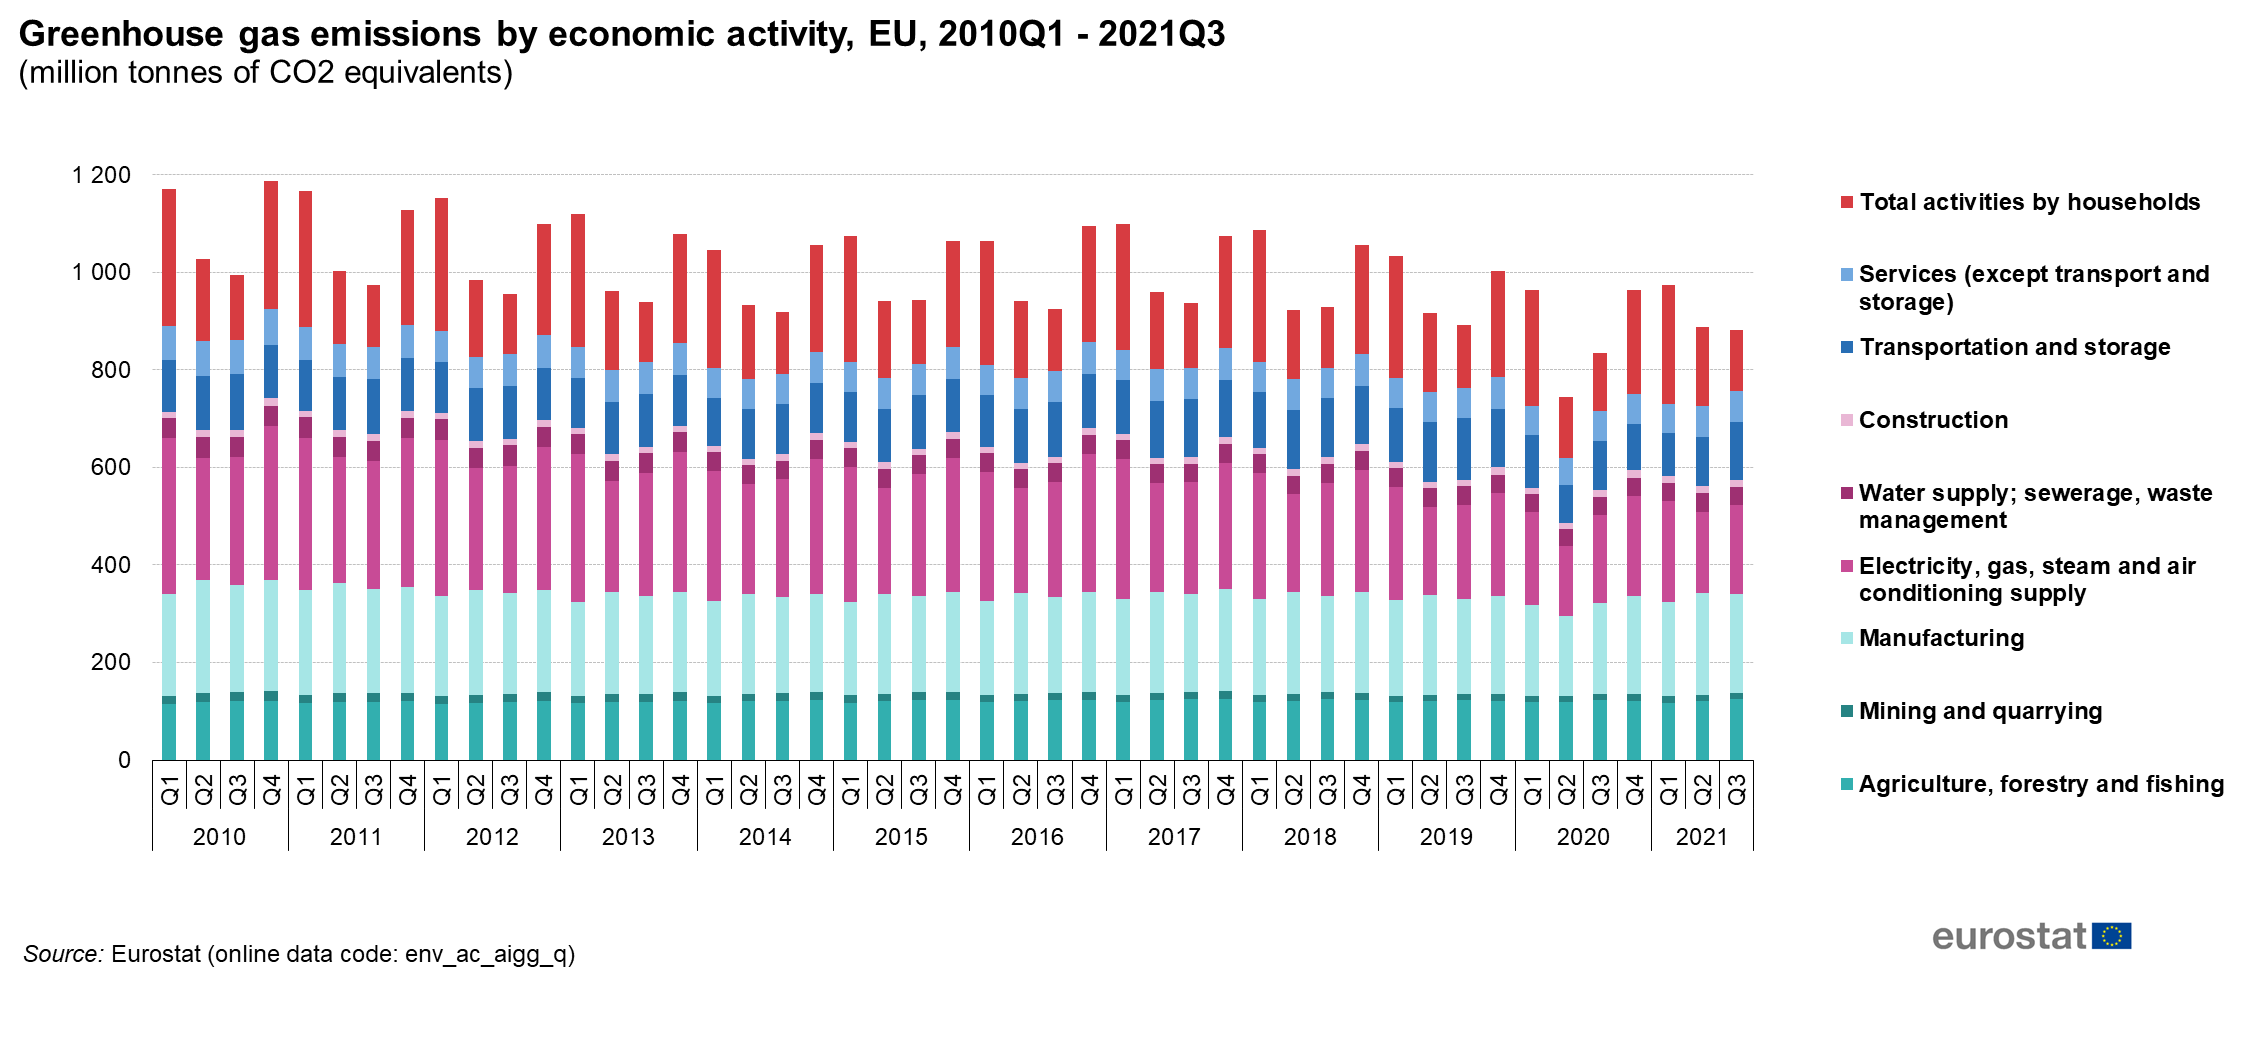
File:Figure 1 Greenhouse gas emissions by economic activity, EU, 2010Q1 - 2021Q3 (million tonnes of CO2 equivalents).png
.png)
.png&diff=cur&oldid=553993)
.png&direction=next&oldid=553993)
.png&diff=next&oldid=553993)
Size of this preview: 800 × 372 pixels. Other resolutions: 320 × 149 pixels | 2,256 × 1,048 pixels.
Original file (2,256 × 1,048 pixels, file size: 216 KB, MIME type: image/png)
File usage
There are no pages that use this file.
.png&oldid=553993)
.png&action=edit&redlink=1)
.png&action=history)