.png)
.png&body=Statistics Explained - Change in deflated price indices of agricultural input and output, 2005-2009 (average annual rate of change, %).png %0A https%3A%2F%2Fec.europa.eu%2Feurostat%2Fstatistics-explained%2Findex.php%3Ftitle%3DFile%3AChange_in_deflated_price_indices_of_agricultural_input_and_output%2C_2005-2009_%28average_annual_rate_of_change%2C_%2525%29.png)
File:Change in deflated price indices of agricultural input and output, 2005-2009 (average annual rate of change, %).png
.png&diff=prev&oldid=53535)
.png&direction=prev&oldid=53535)
.png)
.png&diff=cur&oldid=53535)
.png&direction=next&oldid=53535)
.png&diff=next&oldid=53535)
No higher resolution available.
Change_in_deflated_price_indices_of_agricultural_input_and_output,_2005-2009_(average_annual_rate_of_change,_%).png (547 × 287 pixels, file size: 7 KB, MIME type: image/png)
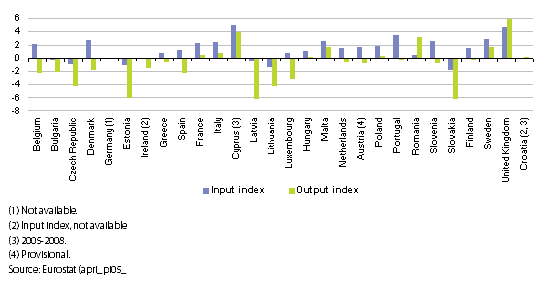
Change in deflated price indices of agricultural input and output, 2005-2009
- (average annual rate of change, %)
Figure created with data from October 2010
Most recent data available now, see:
File usage
There are no pages that use this file.
.png&oldid=53535)
.png&action=edit&redlink=1)
.png&action=history)