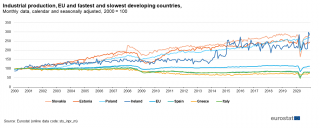
File:Industrial production, EU and fastest and slowest developing countries, Monthly data, calendar and seasonally adjusted, 2000 = 100 F12.png
Revision as of 16:17, 14 June 2021 by Verdodo (talk | contribs) (Verdodo uploaded a new version of File:Industrial production, EU and fastest and slowest developing countries, Monthly data, calendar and seasonally adjusted, 2000 = 100 F12.png)

Size of this preview: 800 × 321 pixels. Other resolutions: 320 × 128 pixels | 1,463 × 587 pixels.
Original file (1,463 × 587 pixels, file size: 94 KB, MIME type: image/png)
File usage
The following page uses this file: