.png)
.png&body=Statistics Explained - Share of spillover impacts of EU consumption per region for five selected indicators, 2018 (%).png %0A https%3A%2F%2Fec.europa.eu%2Feurostat%2Fstatistics-explained%2Findex.php%3Ftitle%3DFile%3AShare_of_spillover_impacts_of_EU_consumption_per_region_for_five_selected_indicators%2C_2018_%28%2525%29.png)
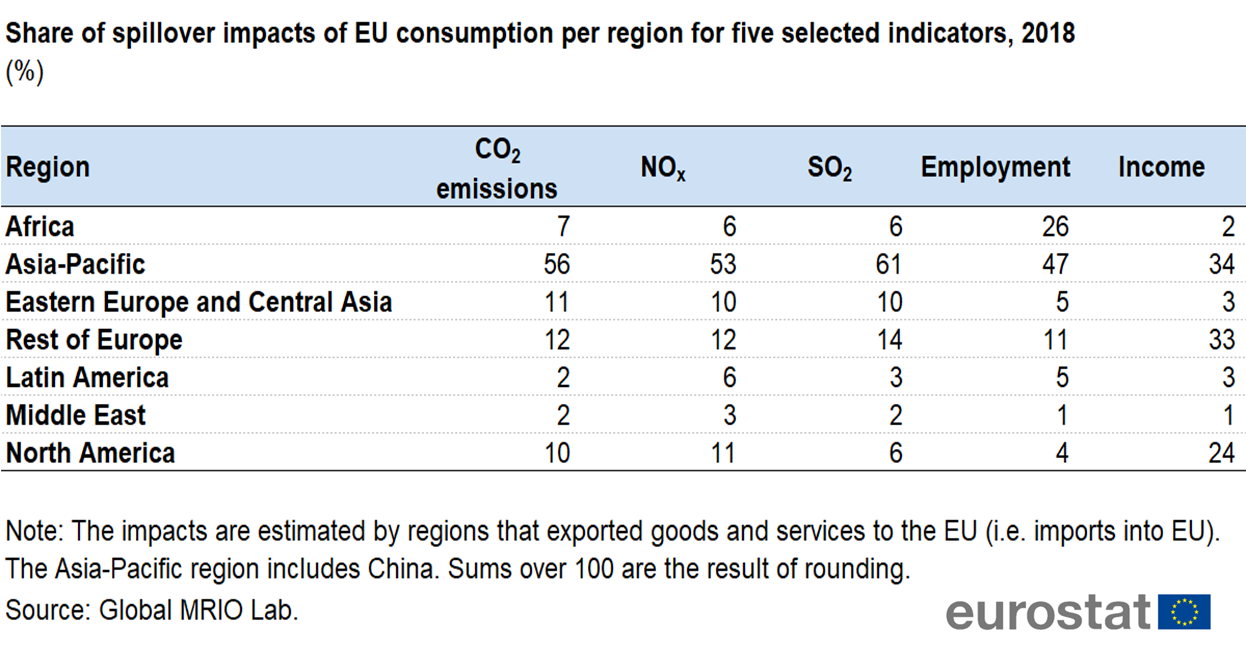
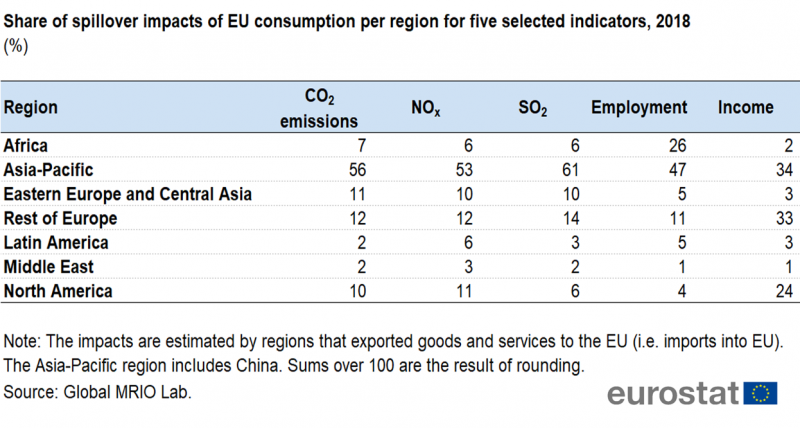
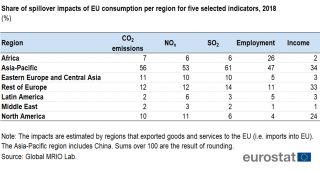
File:Share of spillover impacts of EU consumption per region for five selected indicators, 2018 (%).png
Size of this preview: 800 × 428 pixels. Other resolutions: 320 × 171 pixels | 1,246 × 666 pixels.
Original file (1,246 × 666 pixels, file size: 260 KB, MIME type: image/png)
null
File usage
There are no pages that use this file.
.png&oldid=530120)
.png)
.png&action=edit&redlink=1)
.png&action=history)