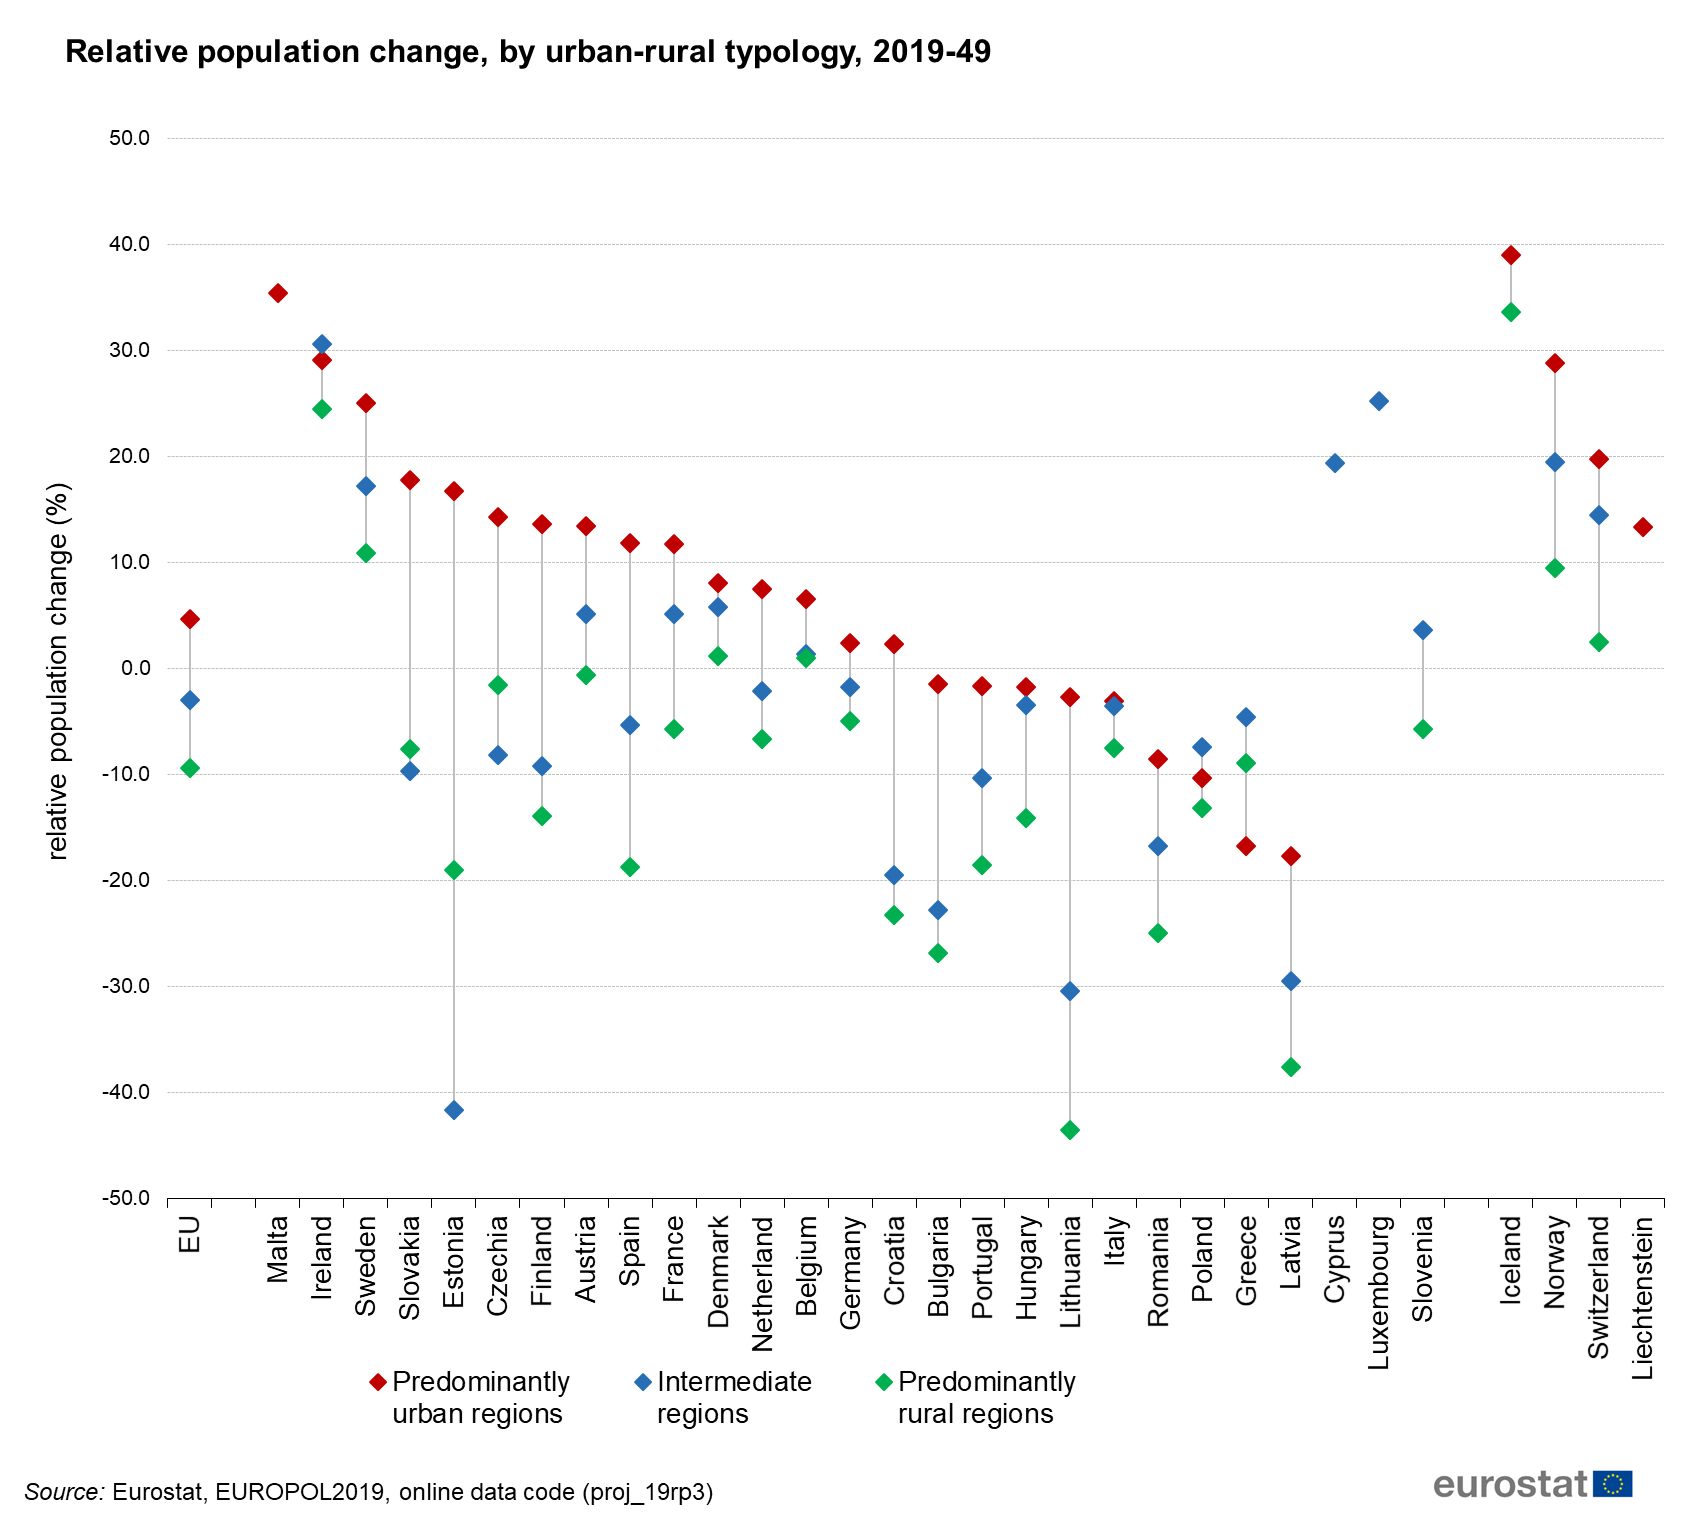
File:Figure2 Relative population change, by urban-rural typology, 2019-49.png
Revision as of 23:08, 19 April 2021 by Senchga (talk | contribs) (Senchga uploaded a new version of "File:Figure2 Relative population change, by urban-rural typology, 2019-49.png")
Size of this preview: 669 × 599 pixels. Other resolutions: 268 × 240 pixels | 1,690 × 1,514 pixels.
Original file (1,690 × 1,514 pixels, file size: 151 KB, MIME type: image/png)
File usage
There are no pages that use this file.