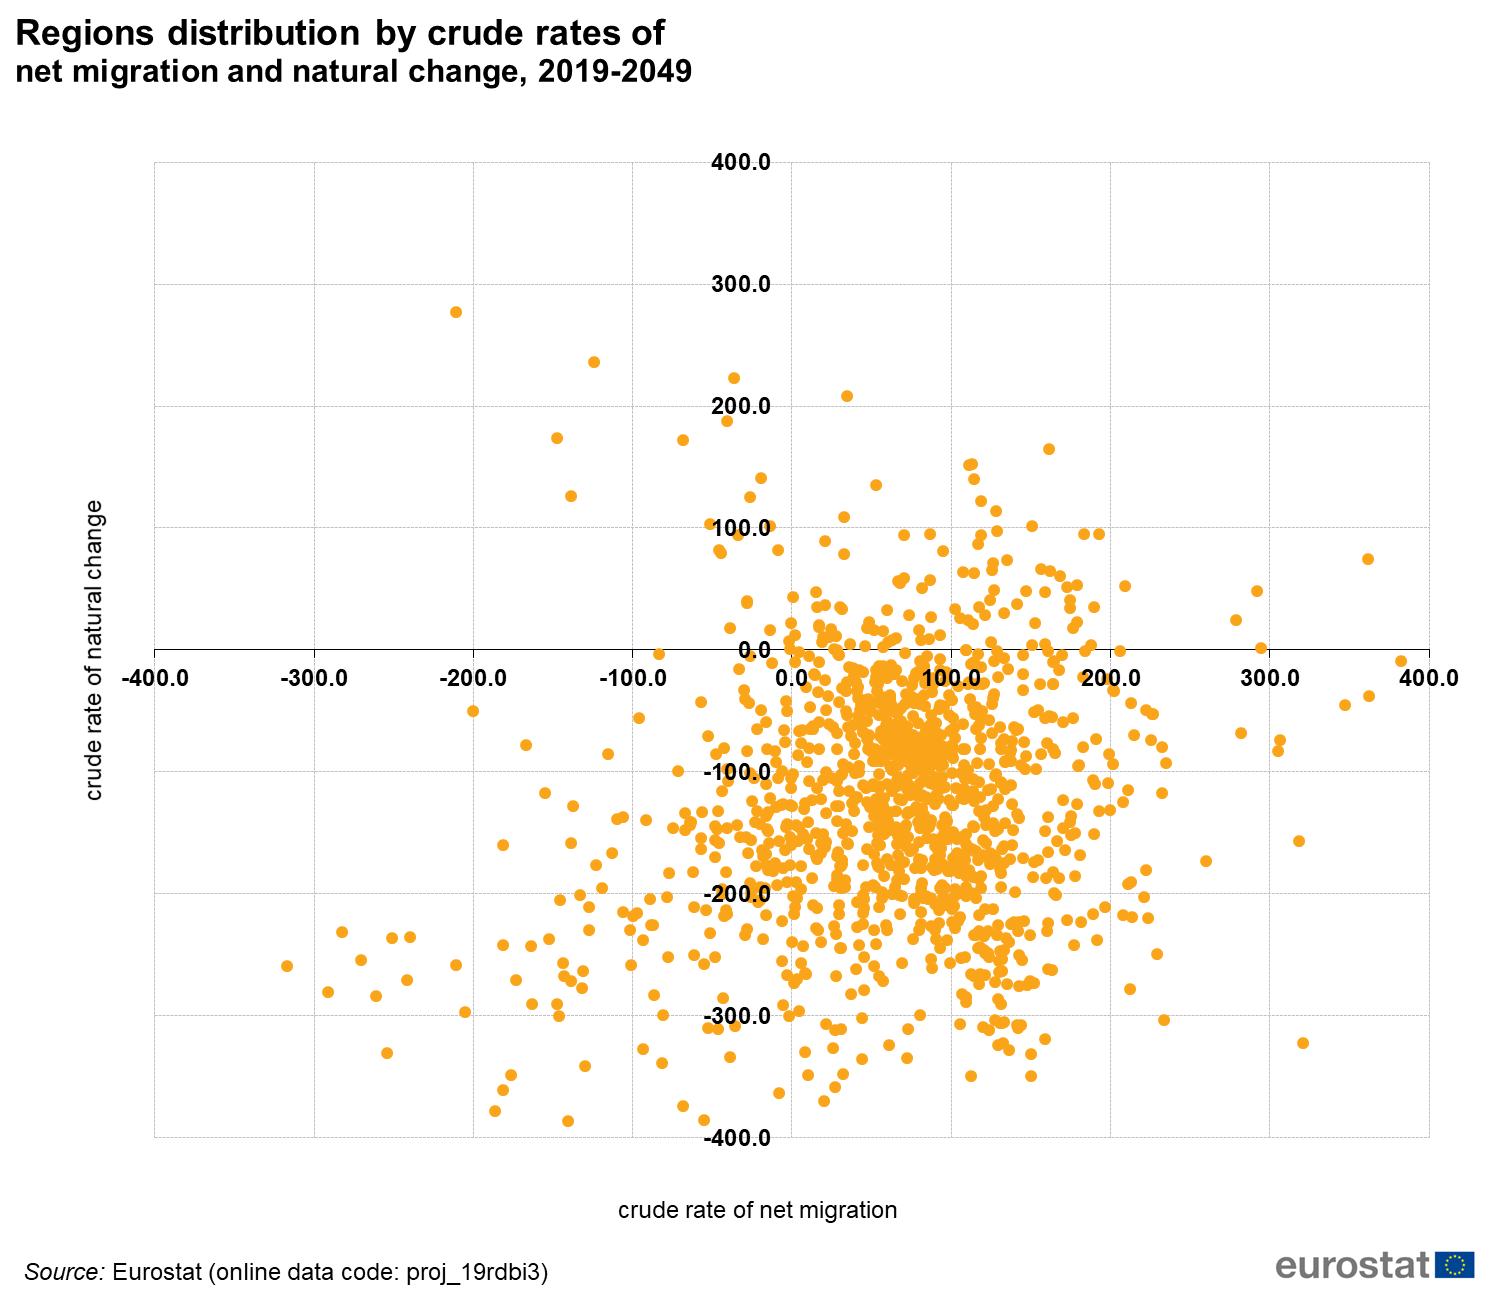
File:Figure5 Regions distribution by crude rates of net migration and natural change, 2019-2049.png
Size of this preview: 696 × 600 pixels. Other resolutions: 279 × 240 pixels | 1,501 × 1,293 pixels.
Original file (1,501 × 1,293 pixels, file size: 163 KB, MIME type: image/png)
File usage
There are no pages that use this file.