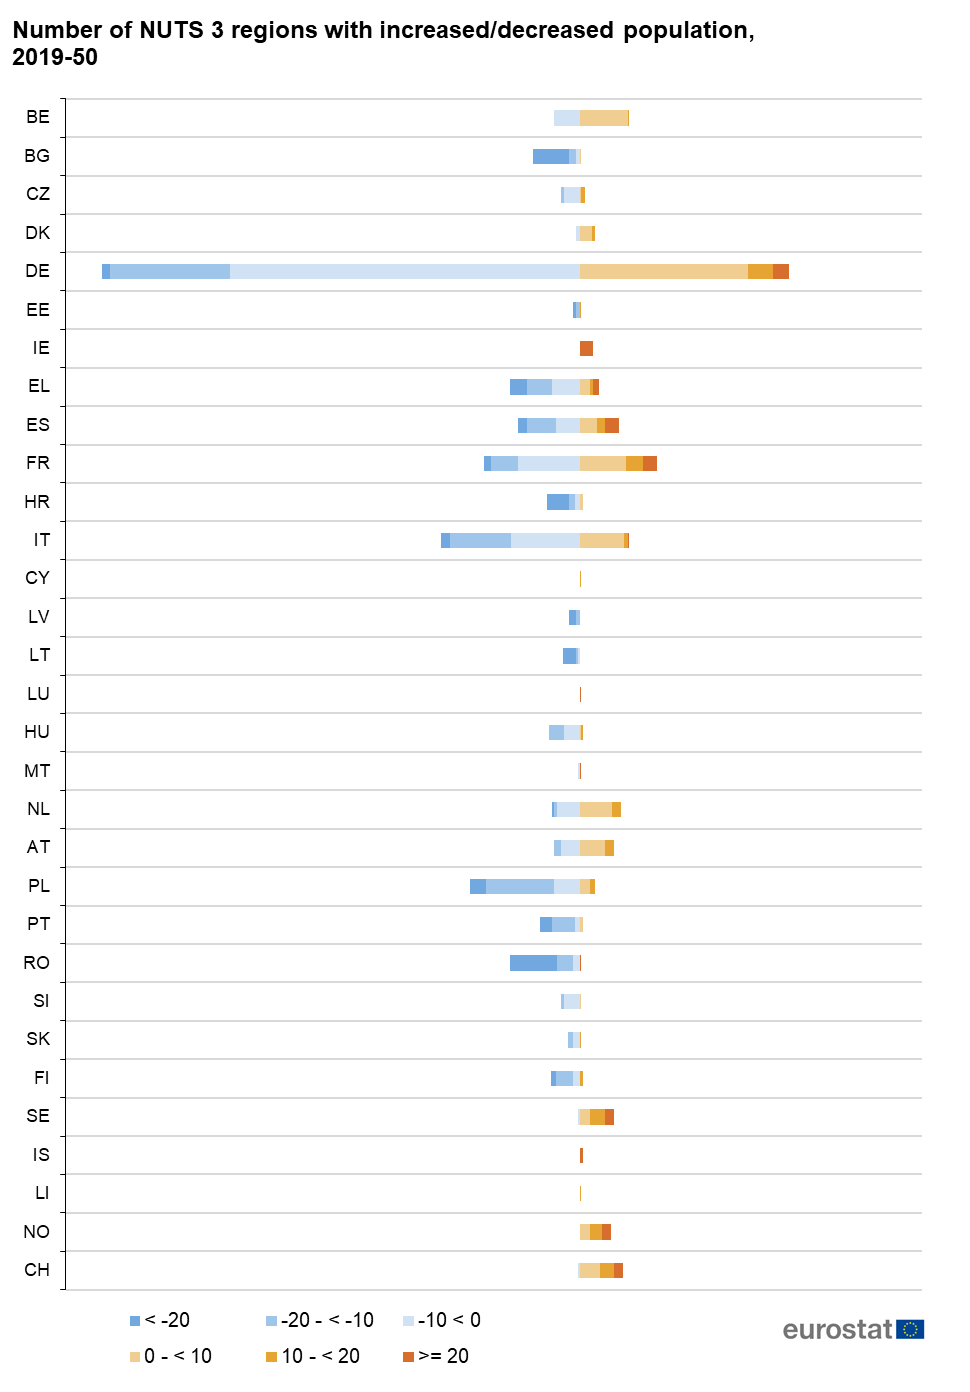
File:Figure1 Number of NUTS 3 regions with increased decreased population, 2019-50.png
Size of this preview: 418 × 600 pixels. Other resolutions: 167 × 240 pixels | 970 × 1,392 pixels.
Original file (970 × 1,392 pixels, file size: 33 KB, MIME type: image/png)
File usage
The following file is a duplicate of this file (more details):
There are no pages that use this file.