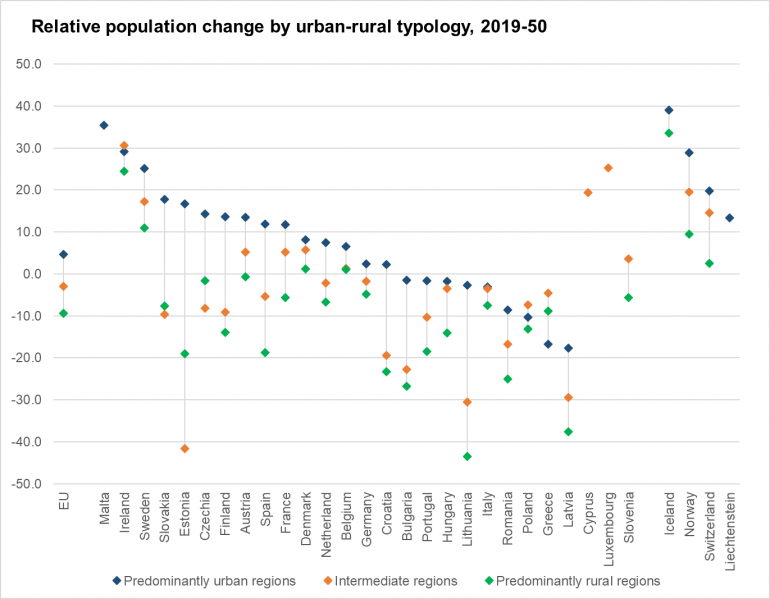
File:Fig2 Relative population change by urban-rural typology, 2019-50.png

Size of this preview: 770 × 599 pixels. Other resolutions: 309 × 240 pixels | 1,371 × 1,067 pixels.
Original file (1,371 × 1,067 pixels, file size: 98 KB, MIME type: image/png)
File usage
The following file is a duplicate of this file (more details):
There are no pages that use this file.