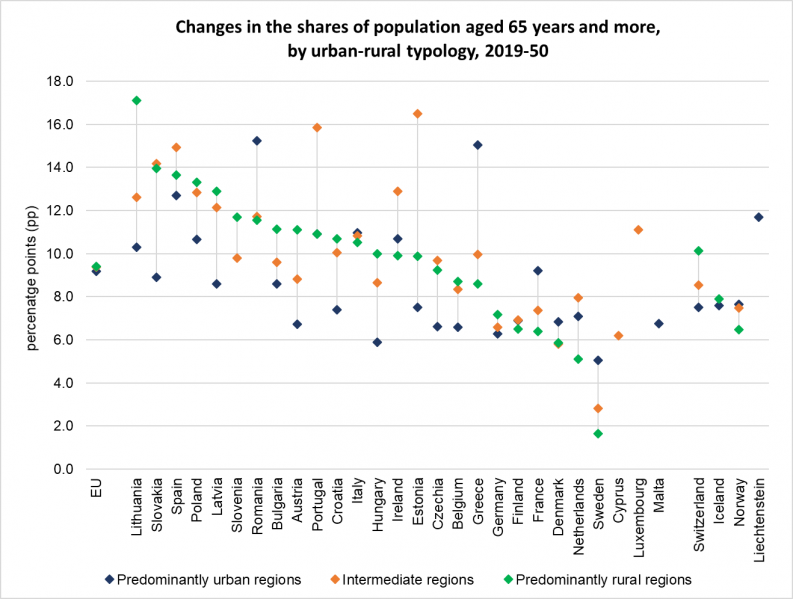
File:Fig3 Changes in the shares of population aged 65 years and more, by urban-rural typology, 2019-50.png
Revision as of 17:55, 6 April 2021 by Senchga (talk | contribs) (Senchga uploaded a new version of "File:Fig3 Changes in the shares of population aged 65 years and more, by urban-rural typology, 2019-50.png")

Size of this preview: 793 × 599 pixels. Other resolutions: 318 × 240 pixels | 1,318 × 996 pixels.
Original file (1,318 × 996 pixels, file size: 110 KB, MIME type: image/png)
File usage
The following file is a duplicate of this file (more details):
There are no pages that use this file.