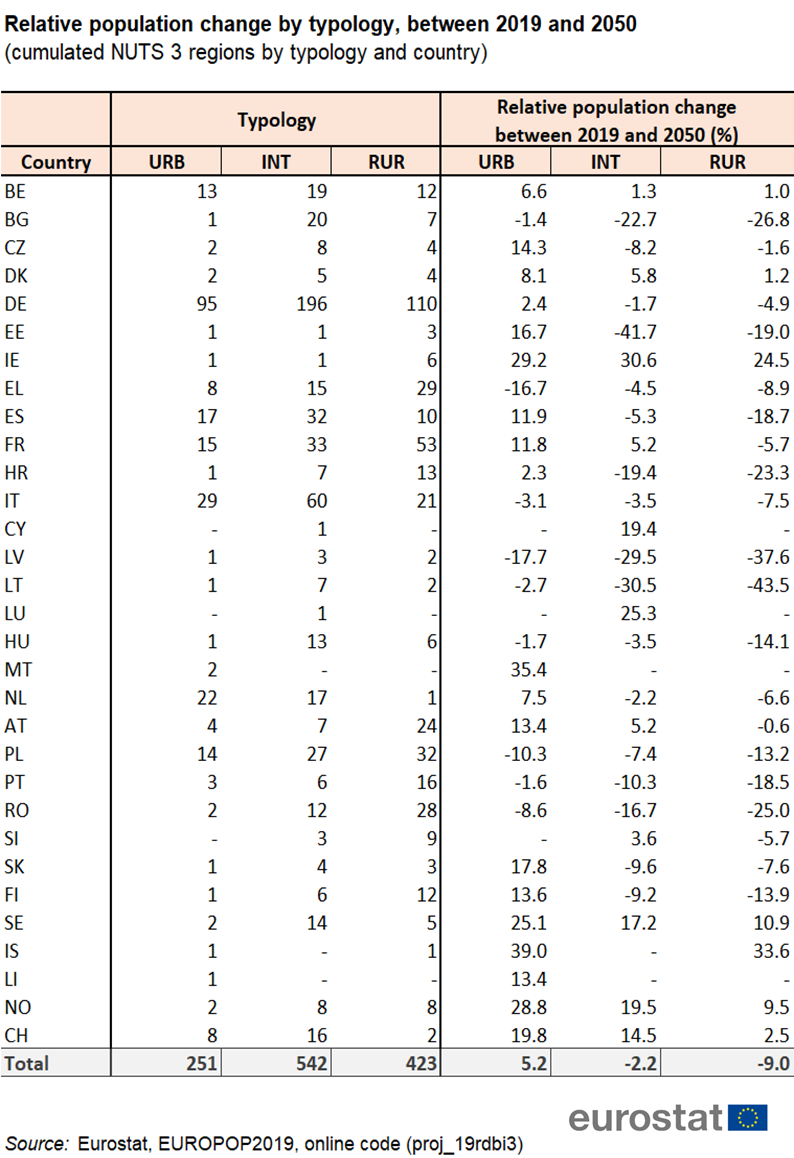
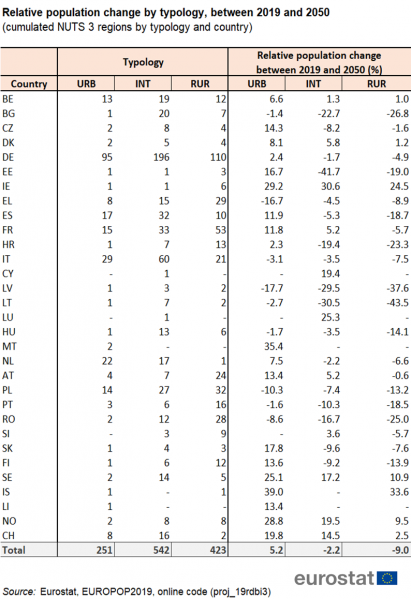
File:Table1 Relative population change by typology, 2019-50.png
Size of this preview: 411 × 599 pixels. Other resolutions: 164 × 240 pixels | 794 × 1,158 pixels.
Original file (794 × 1,158 pixels, file size: 274 KB, MIME type: image/png)
File usage
There are no pages that use this file.