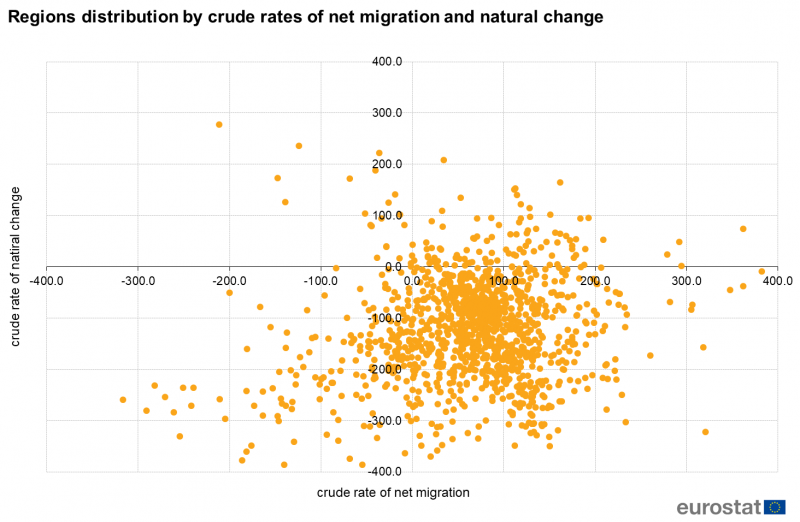
File:Fig3 Regions distribution by crude rates of net migration and natural change.png
Revision as of 22:20, 23 March 2021 by Senchga (talk | contribs) (Senchga uploaded a new version of "File:Fig3 Regions distribution by crude rates of net migration and natural change.png")

Size of this preview: 800 × 522 pixels. Other resolutions: 320 × 209 pixels | 1,464 × 956 pixels.
Original file (1,464 × 956 pixels, file size: 131 KB, MIME type: image/png)
File usage
The following file is a duplicate of this file (more details):
There are no pages that use this file.