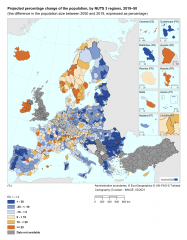
File:Map1 Projected percentage change of the population, by NUTS 3 regions, 2019–50 EPOP2019.png

Size of this preview: 468 × 600 pixels. Other resolutions: 187 × 240 pixels | 1,384 × 1,774 pixels.
Original file (1,384 × 1,774 pixels, file size: 569 KB, MIME type: image/png)
File usage
The following 3 files are duplicates of this file (more details):
There are no pages that use this file.