.png)
.png&body=Statistics Explained - Figure 1 Evolution of EU-27's value of sold industrial production, 2009 - 2019 (2015=100).png %0A https%3A%2F%2Fec.europa.eu%2Feurostat%2Fstatistics-explained%2Findex.php%3Ftitle%3DFile%3AFigure_1_Evolution_of_EU-27%2527s_value_of_sold_industrial_production%2C_2009_-_2019_%282015%253D100%29.png)
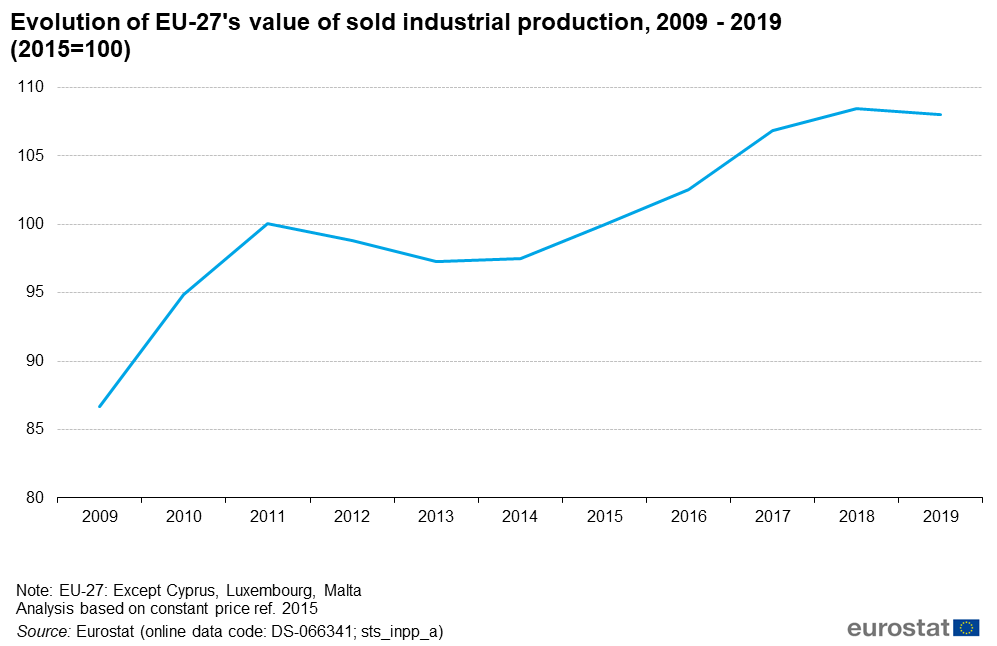
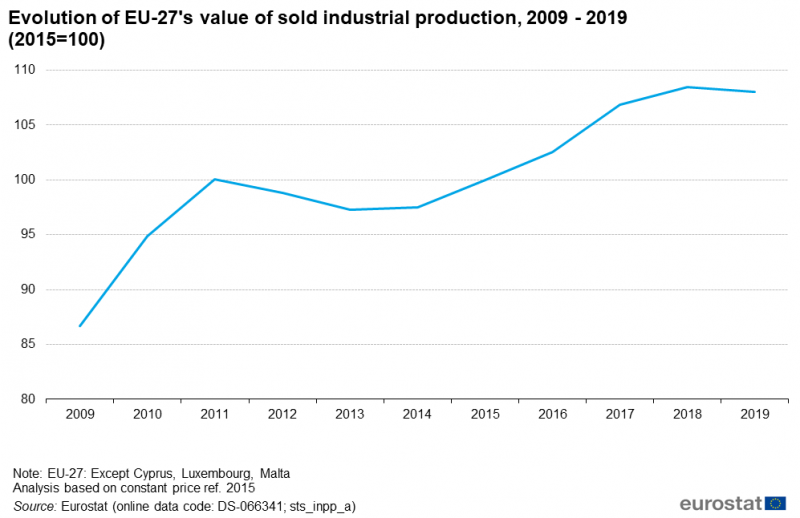
File:Figure 1 Evolution of EU-27's value of sold industrial production, 2009 - 2019 (2015=100).png
Revision as of 10:34, 20 January 2021 by Verdodo (talk | contribs) (Verdodo uploaded a new version of "File:Figure 1 Evolution of EU-27's value of sold industrial production, 2009 - 2019 (2015=100).png")
.png)
.png&diff=prev&oldid=512340)
.png&direction=prev&oldid=512340)
Size of this preview: 800 × 518 pixels. Other resolutions: 320 × 207 pixels | 997 × 646 pixels.
Original file (997 × 646 pixels, file size: 36 KB, MIME type: image/png)
File usage
There are no pages that use this file.
.png&oldid=512340)
.png&action=edit&redlink=1)
.png&action=history)