File:Figure3 Average VAT rate out of consumption by household type 2015.png
Revision as of 12:12, 22 September 2020 by Oehlefr (talk | contribs) (Oehlefr uploaded a new version of "File:Figure3 Average VAT rate out of consumption by household type 2015.png")
Size of this preview: 800 × 430 pixels. Other resolutions: 320 × 172 pixels | 1,000 × 537 pixels.
Original file (1,000 × 537 pixels, file size: 77 KB, MIME type: image/png)
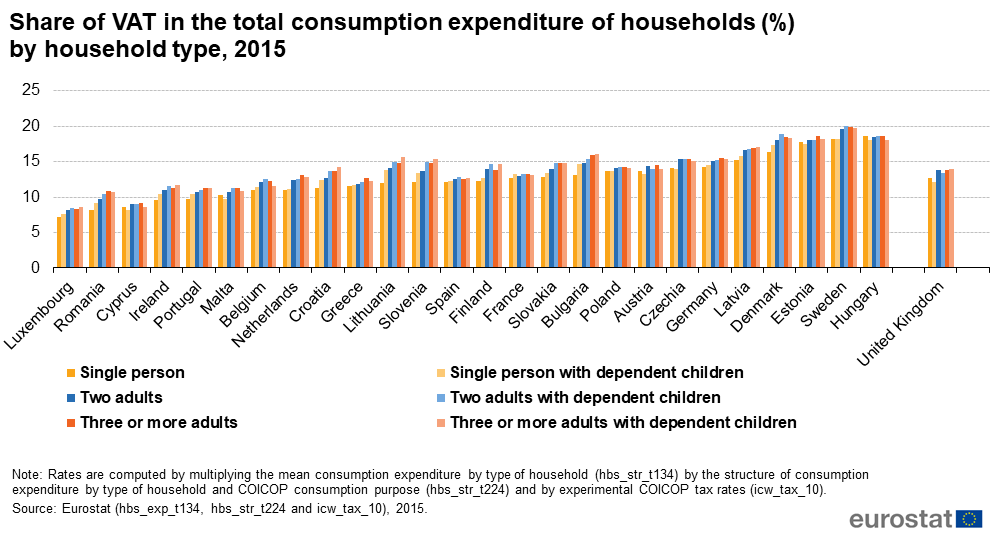
Share of VAT in the overall consumption expenditure of the average household by household type, 2015.
File usage
The following page uses this file: