Archive:Business economy - enterprise demography and inward FATS
- Data from January 2009, most recent data: Further Eurostat information, Main tables and Database
This article belongs to a set of statistical articles which analyse the structure, development and characteristics of the various economic activities in the European Union (EU). The present article is part of the business economy overview, and covers:
- enterprise demography;
- size class analysis.
Main statistical findings
Business demography
Annex IX of the recast structural business statistics Regulation provides for a detailed module for the collection of statistics on business demography. It requires the national statistical institutes (NSIs)]] to produce statistics on enterprise births, deaths and survival rates using common definitions and methodology, which should ensure greater comparability in this field of statistics from the reference year 2008 onwards. Note that for the moment, the statistics presented for this subject have been produced and provided by most of the NSIs on the basis of informal, gentlemen’s agreements.
The starting point for business demography statistics is the concept of the population of active enterprises. These are defined as businesses that had either turnover or employment at any time during the reference period. Data on births and deaths of enterprises, as well as their life expectancy form part of the structural indicators that are used to measure the progress being made towards the European Union's goals set out in the Growth and Jobs Strategy.
Business demography statistics are also a key source of information for analysing entrepreneurial activity. The creation of a new enterprise generally leads to new products or services being offered in a marketplace. In this context, new enterprises can be seen as disturbing market equilibrium and they are therefore often cited as being drivers of competitiveness, as they force existing enterprises to improve their efficiency, while driving inefficient enterprises out of business.
SBS business demography statistics focus on so-called real enterprise births and deaths. Under the definitions employed, births (and deaths) do not include entries into (or exits from) the business enterprise population due to mergers, break-ups, splits or the restructuring of enterprises, nor do they include changes resulting from a change in the enterprise's principal (main) activity.
A birth is defined as an enterprise that was present in year t, but did not exist in the two preceding years. An enterprise is deemed to have survived if, having been a birth in year t or having survived to year t, it is active in terms of employment and/or turnover in any part of year t+1; an enterprise is considered to have survived if it is active in any part of the survival year under consideration. An enterprise death is defined as an enterprise that was active in year t but was no longer present among the active enterprises in the two following years (after checking for any reactivations). It is often quite difficult, statistically, to determine the exact date of cessation of activity with respect to an enterprise death. Indeed, this may well be detected only after a lengthy period (of several years); as such, information presented on enterprise deaths is often provisional in nature and sometimes lags other indicators.
Economic theory suggests that relatively low numbers of enterprise births are likely to be recorded for those activities where high barriers to entry exist, perhaps because a greater level of initial investment in production factors is required to reach a minimum efficient scale of production. Consequently, where barriers to entry (and exit) are lower, as is the case for many services and construction activities, there are generally higher levels of enterprise birth and deaths.
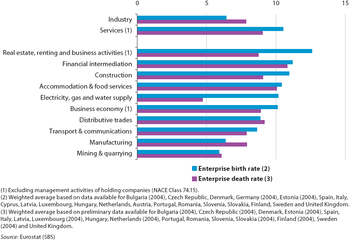
There were approximately 1.75 million newly born enterprises in the business economies of 21 countries for which data are available for 2005 (see Figure 1 for details of the country coverage). To put this into perspective, newly born enterprises accounted for roughly one in every ten (10.1 %) of the stock of active enterprises. Enterprise birth rates were higher for construction (10.9 %) and for services (10.5 %) than for industry (6.4 %).
Figure 1 shows enterprise birth rates and preliminary death rates across a range of NACE sections based on averages compiled from those Member States for which data are available. Real estate, renting and business activities, financial intermediation and construction reported the highest enterprise birth rates (12.6 %, 11.2 % and 10.9 % respectively) and were the only activities (at the NACE section level of detail) to report birth rates above the business economy average.
Based on the available information, a comparison between enterprise birth and death rates can provide some evidence as to net changes in the business enterprise population (note that the number of enterprises may also change as a function of mergers, take-overs, split-offs and break-ups). The birth rate for enterprises within the services sector was 1.5 percentage points higher than the corresponding death rate, whereas for total industry the opposite was observed as the death rate exceeded the birth rate by 1.4 percentage points. The largest difference (5.4 percentage points) between birth and death rates was recorded for electricity, gas and water supply, where the provisional death rate was only 4.7 %. This relatively large difference might, among other reasons, be explained by a recent period of liberalisation within these activities, resulting in the creation of a relatively high number of new energy and water distribution companies.
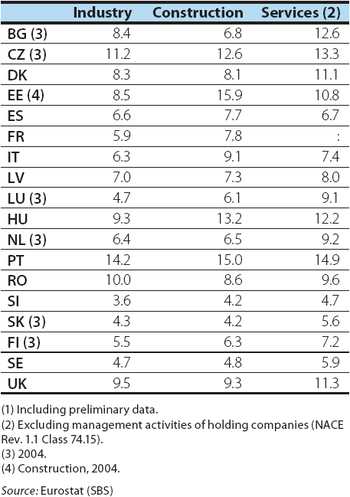
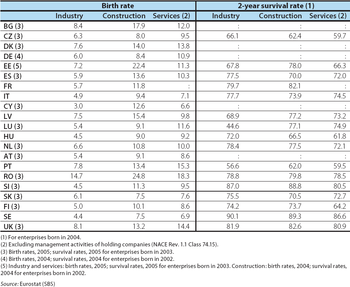
Among the 21 Member States for which data are available (see Tables 1 and 2), those countries with relatively low/high birth rates also tended to report relatively low/high death rates. Italy, Cyprus (2005), Slovakia (2005) and Sweden were among those countries with the lowest levels of renewing their enterprise populations in 2006, while Bulgaria (2005), Denmark (2005), Portugal, Romania (2005) and the United Kingdom (2005) reported some of the highest rates.
Table 2 also presents information on two-year survival rates. Enterprises born in Slovenia, Sweden and the United Kingdom reported some of the highest rates, as upwards of 80 % of all enterprises born in industry, construction or services survived two years.
Foreign-controlled enterprises (inward FATS)
Globalisation has had a considerable impact on the location of production. Many enterprises have extended their operations beyond national borders in an attempt to (amongst other things) increase proximity to customers, circumvent trade or taxation barriers, reduce costs (labour, transportation or material inputs), guarantee the supply of material inputs, or avoid regulation. Groups of (predominantly large) enterprises are at the core of the globalisation process and may be seen as agents of cross-border transactions, as they control decisions, information flows and strategies across a range of countries.
The qualitative nature of information required to define a group's perimeter can often make it difficult to obtain reliable statistical information on these economic actors. One of the main constraints when trying to measure their activities is that global enterprises make their decisions against a worldwide backdrop, while their decisions continue to be analysed using national data collections.
Aside from exporting goods and services or setting-up a new enterprise, there are a number of other alternative actions that enterprises wishing to diversify into new markets can take – one of the main options is to take control of an enterprise in the new market. Information on foreign-controlled enterprises is covered by inward foreign affiliates’ statistics (inward FATS). For the purpose of the inward FATS data collection, the concept of control is defined as the ability to determine general corporate policy; however, in practice, a share of ownership is often used as a proxy. Inward FATS statistics show that the number of foreign affiliates tends to be relatively low. However, given their comparatively large average size, these enterprises often exercise significant economic influence.
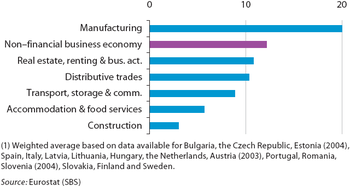
Figure 2 shows that foreign-controlled enterprises accounted for 12.2 % of the workforce in the non-financial business economies of the 16 Member States for which data are available in 2005. The relative importance of foreign-controlled enterprises (using this measure) was considerably higher for the manufacturing sector, rising to 20.0 %. Manufacturing was the only activity (at the NACE Section level) to report that foreign-controlled enterprises provided a higher share of total employment than the non-financial business economy average. In contrast, less than 3 % of the construction sector’s workforce was employed by a foreign-controlled enterprise.
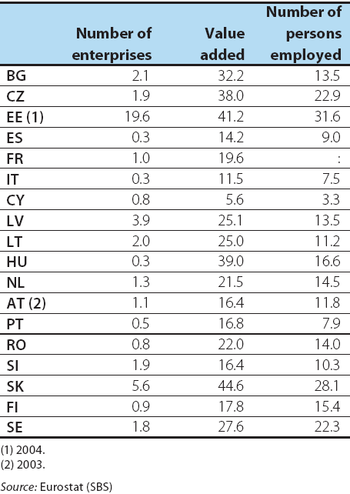
More detailed country information is provided in Table 3, supporting the view that foreign-controlled enterprises had a relatively large average size. Across the countries for which data are available, the share of foreign-controlled enterprises in the total number of enterprises was (with the exception of Estonia) always below 6 % of the total enterprise population, and more generally below a threshold of 2 %. Nevertheless, foreign-controlled enterprises often reported a double-digit share of the non-financial business economy workforce (Cyprus, Italy, Portugal and Spain were exceptions to this rule). Cyprus was also the only country where foreign-controlled enterprises did not create at least 10 % of the total value added generated in the non-financial business economy.
Foreign-controlled enterprises consistently reported a higher share of value added than employment in each of the 17 countries for which data are available for the non-financial business economy – suggesting they were more productive than nationally-owned enterprises. Note that these differences in productivity levels may, at least in part, be due to the larger average size of foreign-controlled enterprises, rather than any inherent difference in productivity levels between nationally-controlled and foreign-controlled enterprises.
Size class analysis
Commission Recommendation 2003/361/EC regarding the definition of SMEs has been in effect since 1 January 2005. In legal terms, a small and medium-sized enterprise (SME) should have fewer than 250 employees. This definition was revised to ensure that enterprises which were part of larger (parent) groups could no longer benefit from SME support schemes, and that help was targeted specifically at independent SMEs. Under the recommendation, enterprises are classified as SMEs when their annual turnover does not exceed EUR 50 million, or their annual balance sheet total does not exceed EUR 43 million. The definition plays an important role as it establishes which SMEs may benefit from EU programmes, policies and competition rules.
However, for reasons of feasibility, the collection of structural business statistics on SMEs only uses the criteria based on employment. As such, for the purpose of the statistics presented hereafter, SMEs are defined as having fewer than 250 persons employed. The sub-population of SMEs may be further divided into:
- micro enterprises (with 1 to 9 persons employed);
- small enterprises (with 10 to 49 persons employed);
- medium-sized enterprises (with 50 to 249 persons employed).
The vast majority of SMEs in the EU are considerably smaller than the threshold of 250 persons. While large enterprises can maintain whole departments to keep up with technological developments, track competitors, attract finance and skilled employees, or develop new products and processes, many smaller enterprises struggle for resources, whether financial, know-how or skills. Furthermore, while larger enterprises may seek to lobby decision-makers in order to tailor laws to their own needs, it is rare for entrepreneurs or SMEs to devote resources to areas such as this.
In an attempt to redress this imbalance, the European Commission has appointed an SME Envoy, who acts as an interface with the SME business community, defending SMEs’ interests in the EU policy-making process. The SME Envoy acts as a channel through which the European Commission is able to take account of the impact which its legislative proposals might have on SMEs. Furthermore, the European Commission has placed SMEs at the centre of their industrial policy-making [1], realising that 'if SMEs are to have a significant impact on Europe’s economy, they need to grow bigger – take on more employees, and expand their product ranges, markets and turnover'.
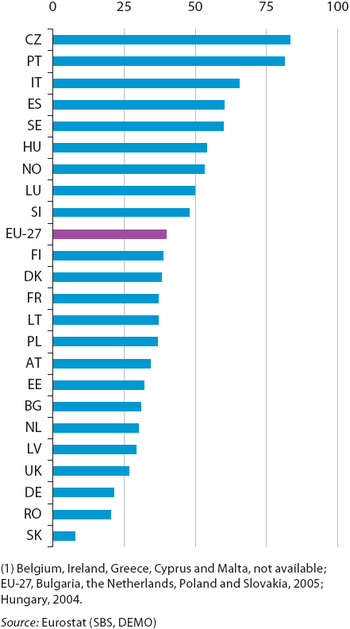
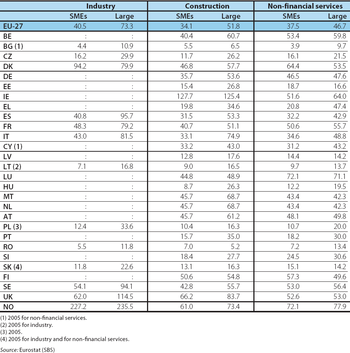
On average there were 39.9 SMEs in the EU-27's non-financial business economy for each 1 000 inhabitants in 2005 (see Figure 3). In 2006 this ratio was more than twice as high (83.4) in the Czech Republic, and close to this level in Portugal, while there was generally a high density of SMEs per 1 000 inhabitants in many of the southern European countries. At the other end of the range, there were just 7.7 SMEs per 1 000 inhabitants in Slovakia (2005), less than half the density recorded in any of the other Member States. Otherwise, Romania, Germany and the United Kingdom also had relatively low levels of SME density.
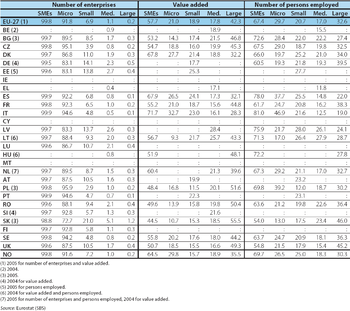
Of the 20 million active enterprises in the EU-27's non-financial business economy in 2006, the overwhelming majority (99.8 %) were SMEs. A closer inspection reveals that 91.8 % of the total were micro enterprises (employing fewer than 10 persons), while 6.9 % were small enterprises (with 10 to 49 persons employed), 1.1 % were medium-sized enterprises (with 50 to 249 persons employed) and the remaining 0.2 % were large enterprises (with 250 or more persons employed).
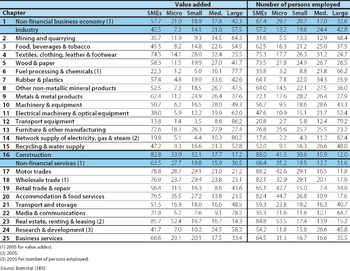
Just over two thirds (67.4 %) of the EU-27's non-financial business economy workforce was employed within an SME in 2006. As such, large enterprises (with 250 or more persons employed) that accounted for just 0.2 % of the enterprise population employed almost one third of the workforce (32.6 %); this share rose to 42.8 % across industrial activities. The relative importance of large enterprises varied considerably between activities, as they employed more than 50 % of the workforce within mining and quarrying, the manufacturing activities of fuel processing and chemicals (2005), electrical machinery and optical equipment, and transport equipment, as well as the network supply of electricity, gas and steam, and the media and communications sector. At the other end of the spectrum, a relatively high proportion of the workforce, upwards of 75 %, were employed in SMEs within the activities of: furniture and other manufacturing activities, motor and wholesale trades (2005), as well as accommodation and food services and real estate, renting and leasing (also 2005), rising to a maximum of 88.0 % for the construction sector.
The economic importance of large enterprises was generally higher in terms of their contribution to total value added (42.3 % of the total) within the EU-27’s non-financial business economy in 2005. There were quite wide disparities across activities, as large enterprises contributed 57.5 % of total value added in the industrial economy, while the corresponding share for non-financial services was 36.5 %, falling further still to just 17.2 % for construction.
The relative importance of SMEs in terms of their contribution to the non-financial business economy workforce varied considerably across countries, as SMEs engaged 81.0 % of the total number of persons employed in Italy in 2006, a share that fell to just under 55 % in Slovakia (2005) and the United Kingdom (see Table 5). Those working in Italian SMEs created 71.7 % of the total value added generated in the non-financial business economy, while in Romania, Poland and Slovakia (data are for 2005 for the latter two countries), large enterprises generated more than 50 % of the total value added.
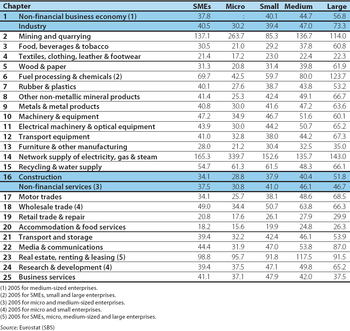
Combining these relative shares of value added and employment suggests that the apparent labour productivity of SMEs was generally lower than that of larger enterprises. This view is supported by economic theory, insofar as it suggests that economies of scale may lead to larger enterprises generating more value added per person employed. This was the case for most of the aggregates used for the structural business statistics sectoral articles (see Table 6). Indeed, mining and quarrying, the manufacture of textiles, clothing, leather and footwear, real estate, renting and leasing, and business services sectors were the only four exceptions where apparent labour productivity was similar or higher among SMEs than it was for large enterprises.
On average, apparent labour productivity in large enterprises (EUR 56.8 thousand per person employed) was about 50 % higher than among SMEs within the EU-27's non-financial business economy in 2006. Differentials in apparent labour productivity ratios between SMEs and large enterprises were generally more marked for industrial activities.
Data sources and availability
The main part of the analysis in this article is derived from structural business statistics (SBS), including core, business statistics which are disseminated regularly, as well as information compiled on a multi-yearly basis, and the latest results from development projects.
Other data sources include Eurostat statistics on DEMO.
Further Eurostat information
Publications
Main tables
Database
Dedicated section
Other Information
- Recommendation 2003/361/EC 6 May 2003 concerning the definition of micro, small and medium-sized enterprises
External links
See also
- Business economy - macroeconomic outlook
- Business economy - structural profile
- Business economy - expenditure, productivity and profitability
- Business economy - employment characteristics
- Business economy - evolution of production, employment and turnover
- Business economy - external trade
Notes
- ↑ More details can be found on the web-site for the Directorate-General for Enterprise and Industry, available at http://ec.europa.eu/enterprise/entrepreneurship/index_en.htm.
