File:Figure2 Average VAT rate out of consumption.png
Revision as of 17:06, 10 September 2020 by Oehlefr (talk | contribs) (Oehlefr uploaded a new version of "File:Figure2 Average VAT rate out of consumption.png")
Size of this preview: 800 × 437 pixels. Other resolutions: 320 × 175 pixels | 975 × 533 pixels.
Original file (975 × 533 pixels, file size: 80 KB, MIME type: image/png)
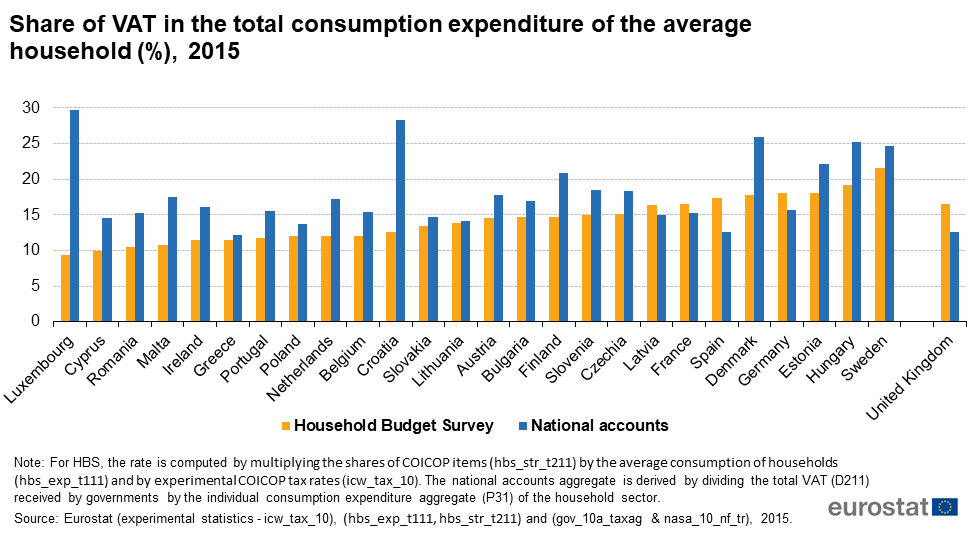
Share of VAT (%) in the overall consumption expenditure of the average household, derived from 2015 National Accounts and Household Budget Survey data.
File usage
The following page uses this file: