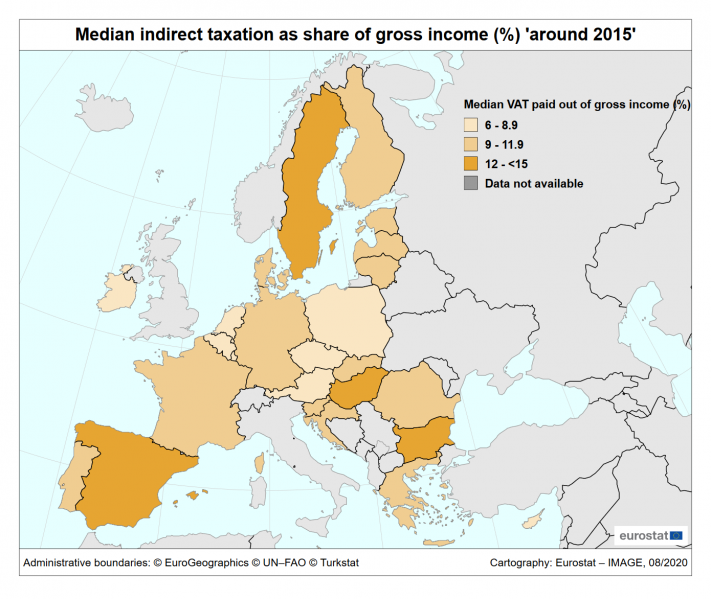
File:Figure5 Median-VAT-out-of-gross-income map 2015.png

Size of this preview: 711 × 599 pixels. Other resolutions: 285 × 240 pixels | 1,390 × 1,172 pixels.
Original file (1,390 × 1,172 pixels, file size: 217 KB, MIME type: image/png)
Median amount of VAT paid by households as share of their gross income (%), around 2015.
File usage
The following page uses this file: