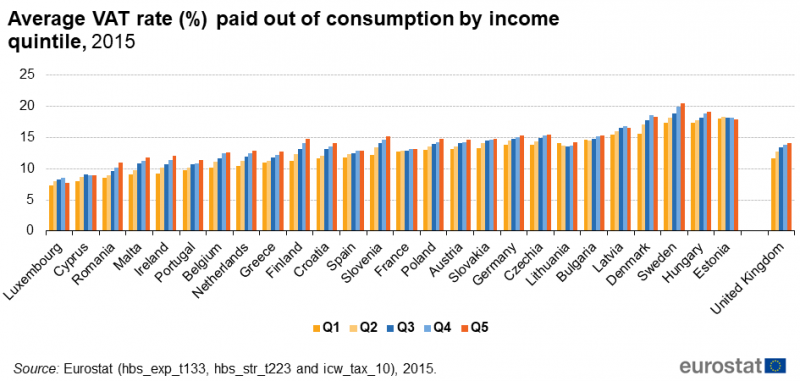
File:Figure2 Average VAT rate out of consumption by income quintile.png

Size of this preview: 800 × 381 pixels. Other resolutions: 320 × 152 pixels | 945 × 450 pixels.
Original file (945 × 450 pixels, file size: 59 KB, MIME type: image/png)
Share of VAT in the overall consumption expenditure of households by level of income, 2015.
File usage
There are no pages that use this file.