Archive:Hours of work and absences from work - quarterly statistics

Data extracted in July 2020
Planned article update: October 2020
Highlights
During the first quarter of 2020, the labour market was affected by COVID-19 measures taken by Member States. Employment and unemployment, as defined by the ILO concept, are in this particular situation, not sufficient to describe the developments taking place in the labour market. Therefore, Eurostat was triggered to develop a set of additional seasonally adjusted quarterly indicators which should help to capture the most recent movements on the labour market in the 27 Member States of the European Union (EU).
The newly developed indicators include the total labour market slack, which comprises all persons who have an unmet need for employment either because they are unemployed according to the ILO definition, are close to unemployment while not fulfilling all ILO criteria, or are working part-time and would like to work additional hours. Furthermore, absences from work broken down by reason are published, as well as an index of total actual hours worked in the main job. Recent job leavers and starters, as well as weekly total absences and transitions out of employment, complete the set of newly developed indicators.
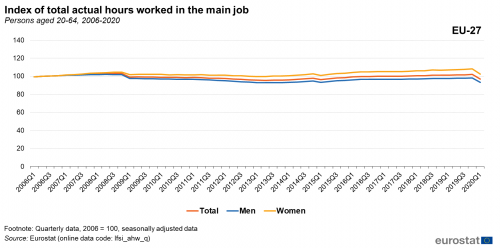
In this article, the focus is on the quarterly changes in the actual hours worked in the main job, using an index where the reference (100 %) is the year 2006. The index indicates the percentage of change in the total hours of work in the considered quarter of a year compared to the total working hours in 2006. The value of the index is influenced by the number of employed people in the considered quarter of a year, as well as by the number of hours worked by each of these employed people. Please note that the presented data is seasonally adjusted.
This article aims to describe the hours of work in the European Union (EU) as a whole, for all EU Member States individually, as well as for the United Kingdom, three EFTA countries (Iceland, Norway and Switzerland) and four candidate countries (Macedonia, North Macedonia, Serbia and Turkey).
The article is a part of the online publication Labour market in the light if the COVID-19 pandemic - quarterly statistics alongside namely with the articles Labour market slack - unmet need for employment and Absences from work.
Full article
Sharp drop in the working hours at EU level in the first quarter of 2020
Between the last quarter of 2019 and the first quarter of 2020, the index of total actual hours worked in the main job (computed using the year 2006 as reference with an index of 100 points) dropped sharply in the EU-27: from 101.9 index points to 96.8 index points (decrease of 5.1 index points) (see Figure 1). Since the beginning of the time series (first quarter of 2006), the lowest level of the index can be found in the second quarter of 2013, with 95.4 index points (compared to 2006 it dropped by 4.6 index points). This resulted from the financial and economic crisis which started in 2008.

Source: Eurostat (lfsi_ahw_q)
Looking at the gender differences, women were hit harder than men by the COVID-19 crisis. The index of total actual working hours for the female population fell from 108.0 to 102.4 index points between the last quarter of 2019 and the first quarter of 2020 (decrease of 5.6 index points). For the male population, it dropped from 97.9 to 93.1 index points (decrease of 4.8 index points).
Nevertheless, in the first quarter of 2020, the index of total actual hours worked is still higher for women (102.4 index points) than for men (93.1 index points), meaning than the total hours of work has more increased since 2006 for the female population than for the male population. With an index lower than 100, the total hours worked for the male population has even decreased since the reference year of 2006.
Impact on working hours at country level
The total working hours have been affected differently across countries since 2006. Different patterns can indeed be observed (see Video 1).
 Video 1: Index of total actual hours worked in the main job by country and sex
Click the image for an interactive view of the data
In Europe, Italy was the first country hit by the COVID-19 pandemic. Difference in the total working hours between the fourth quarter of 2019 and the first quarter of 2020 is highly visible in this country: the index of total actual hours worked in the main job decreased from 99.2 index points in the fourth quarter of 2019 to 89.6 index points in the first quarter of 2020 (decrease of 9.7 index points). Women were mostly affected: the female population corresponds to a drop from 107.0 to 96.0 index points (decrease of 11.0 index points), while the male population corresponds to a fall from 95.1 to 86.3 index points (decrease of 8.8 index points). The financial and economic crisis of 2008 had an smaller impact on the working hours than the COVID-19 crisis in this Member State.
In contrast, the impact of the COVID-19 crisis was small in Bulgaria: the index of working hours accounted for 100.3 points in the last quarter of 2019 and for 98.6 points in the first quarter of 2020 (decrease of 1.7 index points). The 2008 financial and economic crisis showed more impact on the working hours: the index reached its highest level of 109.2 points in the first quarter of 2008 and its lowest level of 93.7 points in the fourth quarter of 2012 (difference of 15.5 index points). Bulgarian men and women were similarly affected in terms of hours worked by the two crises.
Malta recorded a strong decrease in the index of total hours worked between the last quarter of 2019 and the first quarter of 2020: 174.8 points versus 164.4 points (decrease of 10.4 index points). Nevertheless, this country still registered in the first quarter of 2020 the highest index level among all EU Member States. The index level was even bigger for women, with an index of 233.8 points in the first quarter of 2020, than for men, with an index of 139.4 points in that quarter. Nevertheless, men were more affected, in terms of hours worked, than women by the COVID-19 crisis: the male index passed from 150.8 points in the last quarter of 2019 to 139.4 points in the first quarter of 2020 (decrease of 11.4 index points) while the female index passed from 241.4 points to 233.8 points (decrease of 7.6 index points).
In Greece, the index of total hours worked in the main job was more affected by the 2008 financial and economic crisis than by the COVID-19 crisis (situation in the first quarter of 2020). The index reached its lowest level, with 76.4 points, in the fourth quarter of 2013. It was slightly higher in the first quarter of 2020, i.e. 78.4 points, while the index accounted for 85.1 points in the last quarter of 2019.
Focus on the changes between the last two quarters
In this section, the change in the total actual working hours between the last quarter of 2019 and the first quarter of 2020 will be analysed in terms of relative changes taking the last quarter of 2019 as reference; the percentage of increase or decrease between these two consecutive quarters will be presented.
Italy is the most affected country
As previously shown, all Member States, for which data is available, experienced a drop in the index of total actual hours worked in the main job between the last quarter of 2019 and the first quarter of 2020, except Finland. Taking the percentage of change between these two consecutive quarters (taking the last quarter of 2019 as reference) the highest decrease was observed in Italy (-9.7 %), followed by Slovakia (-8.7 %), Greece and Austria (both -7.9 %) (see Figure 2). In contrast, Finland recorded an increase of +0.2 %.

Source: Eurostat (lfsi_ahw_q)
Women hit the hardest
The change in the total actual hours worked in the main job between the fourth quarter of 2019 and the first quarter of 2020 is more visible at EU level for the female population than for the male population: -5.2 % for women against -4.9 % for men (see Figure 3).
Among Member States, Italian and Slovakian women were the most affected in terms of working hours, during the starting period of the COVID-19 crisis: they registered between the last quarter of 2019 and the first quarter of 2020 a decrease in working hours of 10.3 % and 10.2 % respectively. Italian and Slovakian men were also hardly affected, with a respective decrease of 9.3 % and 7.6 % in their working hours. In Austria, Hungary, Malta, Greece and France, men also registered between the last quarter of 2019 and the first quarter of 2020 a noticeable decrease in their total working hours: 8.0 %, 7.9 %, 7.6 %, 7.5 % and 7.1 % respectively. Their female counterparts corresponded to a decrease of 7.8 %, 0.7 %, 3.1 %, 8.3 % and 4.3 % respectively.

Source: Eurostat (lfsi_ahw_q)
Source data for tables and graphs
- [[Media:Hours of work_fig2-axis changed.xls|Hours_of_work_Figures_1-3-4]

- Hours_of_work_Figure2_video
Data sources
All figures in this article are based on seasonally adjusted quarterly results from European labour force survey (EU-LFS).
Source: The European Union labour force survey (EU-LFS) is the largest European household sample survey providing quarterly and annual results on labour participation of people aged 15 and over as well as on persons outside the labour force. It covers residents in private households. Conscripts in military or community service are not included in the results. The EU-LFS is based on the same target populations and uses the same definitions in all countries, which means that the results are comparable between countries.
European aggregates: EU refers to the sum of EU-27 Member States. If data are unavailable for a country, the calculation of the corresponding aggregates takes into account the data for the same country for the most recent period available. Such cases are indicated.
Definitions: The concepts and definitions used in the labour force survey follow the guidelines of the International Labour Organisation.
Five different articles on detailed technical and methodological information are linked from the overview page of the online publication EU labour force survey.
Context
The COVID-19 virus hit Europe in January and February 2020, with the first cases confirmed in Spain, France and Italy. COVID-19 infections have now been diagnosed in all European Union (EU) Member States.
To fight the pandemic, EU Member States have taken a wide variety of measures.
From the second week of March, most countries closed retail shops apart from supermarkets, pharmacies and banks. Bars, restaurants and hotels have also been closed. In Italy and Spain, non-essential production was stopped and several countries imposed regional or even national lock-down measures which further stifled the economic activities in many areas.
In addition, schools were closed, public events were cancelled and private gatherings (with numbers of persons varying from 2 to 50) were banned in most Member States.
The large majority of the prevention measures were taken during mid-March 2020 and most of the prevention measures and restrictions were kept for the whole of April and May 2020.
The first quarter 2020 is consequently the first quarter in which the labour market across the EU has been affected by COVID-19 measures taken by the Member States.
Employment and unemployment as defined by the ILO concept are, in this particular situation, not sufficient to describe the developments taking place in the labour market. In this first phase of the crisis, active measures to contain employment losses led to absences from work rather than dismissals, and individuals could not search for work or were not available due to the containment measures, thus not counting as unemployed.
Direct access to
Main tables
- Title(s) of second level folder (if any)
- Title(s) of third level folder (if any)
Database
- Title(s) of second level folder (if any)
- Title(s) of third level folder (if any)
Dedicated section
Publications
Publications in Statistics Explained (either online publications or Statistical articles) should be in 'See also' above
Methodology
<link to ESMS file, methodological publications, survey manuals, etc.>
- Crime and criminal justice (ESMS metadata file — crim_esms)
- Title of the publication
Legislation
- Use Eur-Lex icon on the ribbon tool at the top of the statistical article to enter the year and reference of your regulation or directive.
- See example of what should be issued hereafter
- Regulation (EU) No 1013/2016
Visualisations
- Regional Statistics Illustrated - select statistical domain 'xxx' (= Agriculture, Economy, Education, Health, Information society, Labour market, Population, Science and technology, Tourism or Transport) (top right)
External links
Notes
<footnote text will be automatically inserted if reference tags are used in article content text (use reference icon on ribbon)>
[[Category:<Subtheme category name(s)>|Name of the statistical article]] [[Category:<Statistical article>|Name of the statistical article]]
Delete [[Category:Model|]] below (and this line as well) before saving!