Archive:SDG 1 - No poverty (statistical annex)
End poverty in all its forms everywhere (statistical annex)
Data extracted in May 2020.
Planned article update: June 2021.
Highlights

This article provides an overview of statistical data on SDG 1 ‘No poverty’ in the European Union (EU). It is based on the set of EU SDG indicators for monitoring of progress towards the UN Sustainable Development Goals (SDGs) in an EU context.
This article is part of a set of statistical articles, which are based on the Eurostat publication ’Sustainable development in the European Union — Monitoring report - 2020 edition’. This report is the fourth edition of Eurostat’s series of monitoring reports on sustainable development, which provide a quantitative assessment of progress of the EU towards the SDGs in an EU context.
Full article
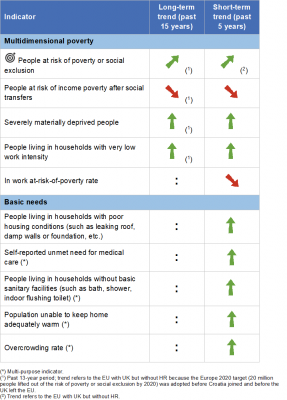
Table 1: Indicators measuring progress towards SDG 1, EU-27

Table 2: Explanation of symbols for indicating progress towards SD objectives and targets


People at risk of poverty or social exclusion

While a household's income is a key determinant of its standard of living, other aspects can prevent people from fully participating in society such as an impeded access to labour markets or material deprivation. To reflect these different dimensions of poverty, the broad indicator ‘at risk of poverty or social exclusion’ shows the number of people affected by at least one of the following three forms of poverty or social exclusion: income poverty, severe material deprivation and very low work intensity. Data on the three sub-indicators are derived from the EU Statistics on Income and Living Conditions (EU-SILC).
.png)
Source: Eurostat (sdg_01_10)
_of_people_at_risk_of_poverty_or_social_exclusion,_EU,_2020.png)
Source: Eurostat (sdg_01_10)
.png)
Source: Eurostat (sdg_01_10)

Source: Eurostat (ilc_pees01)
.png)
Source: Eurostat: (ilc_pees01), (ilc_peps02), (ilc_peps03), (ilc_peps04), (ilc_peps06), (ilc_peps13), (ilc_peps60) and (hlth_dpe010)
People at risk of income poverty after social transfers

This indicator measures the number of people with an equivalised disposable income below the risk-of-poverty threshold. This is set at 60 % of the national median equivalised [1] disposable income after social transfers. The data stem from the the EU Statistics on Income and Living Conditions (EU-SILC).
.png)
Source: Eurostat (sdg_01_20)
_of_people_at_risk_of_income_poverty_after_social_transfers,_EU,_2020.png)
Source: Eurostat (sdg_01_20)
.png)
Source: Eurostat (sdg_01_20)
Severely materially deprived people

This indicator covers issues relating to economic strain, durables, housing and the environment of dwellings. Severely materially deprived people have living conditions that are greatly constrained by a lack of resources, which means they cannot afford at least four of the following items: to pay their rent or utility bills, to keep their home warm, to pay unexpected expenses, to eat meat, fish or a vegetarian equivalent every second day, a week holiday away from home, a car, a washing machine, a colour TV or a telephone. Data for this indicator stem from the EU Statistics on Income and Living Conditions (EU-SILC).
.png)
Source: Eurostat (sdg_01_30)
_of_severely_materially_deprived_people,_EU,_2020.png)
Source: Eurostat (sdg_01_30)
.png)
Source: Eurostat (sdg_01_30)
People living in households with very low work intensity

This indicator describes the number of people aged 0 to 59 living in households where the adults worked no more than 20 % of their work potential during the past year. The EU Statistics on Income and Living Conditions (EU-SILC) is the data source for this indicator.
.png)
Source: Eurostat (sdg_01_40)
_of_people_living_in_households_with_very_low_work_intensity,_EU,_2020.png)
Source: Eurostat (sdg_01_40)
.png)
Source: Eurostat (sdg_01_40)
In work at-risk-of-poverty rate

This indicator refers to the share of employed people aged 18 years or over at risk of income poverty. People are considered ‘employed’ if they held a job for more than half of the reference year. Data for this indicator are taken from the EU Statistics on Income and Living Conditions (EU-SILC).
.png)
Source: Eurostat (sdg_01_41)
_of_in_work_at-risk-of-poverty_rate,_EU,_2020.png)
Source: Eurostat (sdg_01_41)
.png)
Source: Eurostat (sdg_01_41)
People living in households with poor housing conditions (such as leaking roof, damp walls or foundation, etc.)

The indicator reflects the share of the population with at least one of the following deficits in their home: a leaking roof, damp walls, floors or foundation, or rot in window frames or floor. This indicator is derived from the EU Statistics on Income and Living Conditions (EU-SILC).
.png)
Source: Eurostat (sdg_01_60)
_of_population_living_in_a_dwelling_with_a_leaking_roof,_damp_walls,_floors_or_foundation_or_rot_in_window_frames_of_floor,_EU,_2020.png)
Source: Eurostat (sdg_01_60)
.png)
Source: Eurostat (sdg_01_60)
Direct access to
More detailed information on EU SDG indicators for monitoring of progress towards the UN Sustainable Development Goals (SDGs), such as indicator relevance, definitions, methodological notes, background and potential linkages, can be found in the introduction of the publication ’Sustainable development in the European Union — Monitoring report - 2020 edition’.
Notes
- ↑ The equivalised disposable income is the total income of a household, after tax and other deductions, that is available for spending or saving, divided by the number of household members converted into equalised adults; household members are equalised or made equivalent by weighting each according to their age, using the so-called modified OECD equivalence scale.