.png)
.png&body=Statistics Explained - Figure3 Value of sold production by group of manufacturing activity, EU-28, 2008 and 2018 (% share of total sold production).png %0A https%3A%2F%2Fec.europa.eu%2Feurostat%2Fstatistics-explained%2Findex.php%3Ftitle%3DFile%3AFigure3_Value_of_sold_production_by_group_of_manufacturing_activity%2C_EU-28%2C_2008_and_2018_%28%2525_share_of_total_sold_production%29.png)
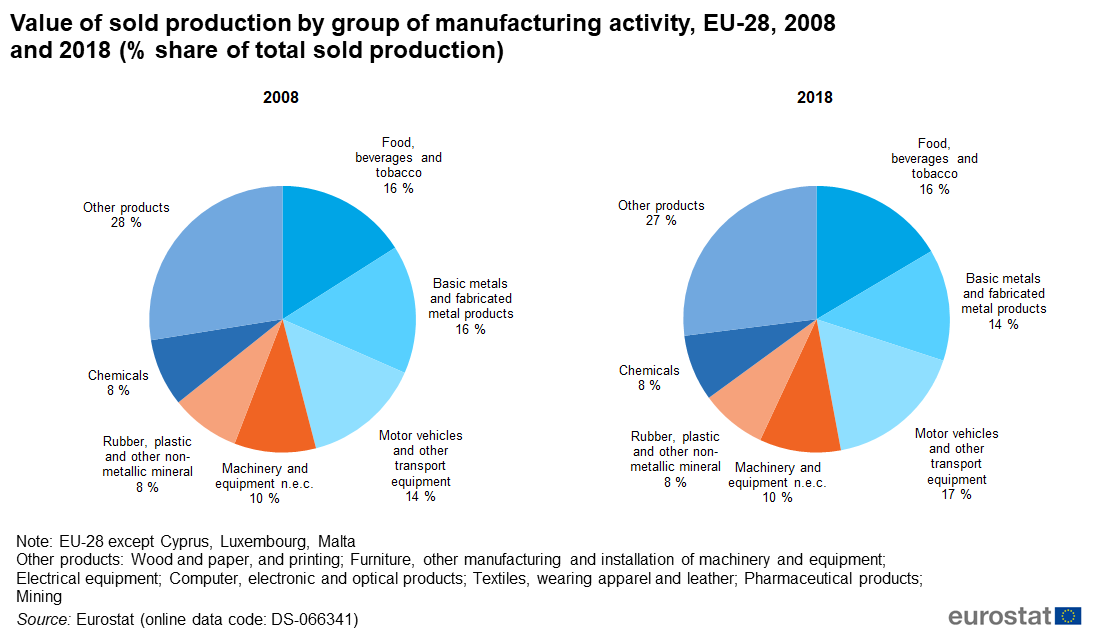
File:Figure3 Value of sold production by group of manufacturing activity, EU-28, 2008 and 2018 (% share of total sold production).png
Size of this preview: 800 × 462 pixels. Other resolutions: 320 × 185 pixels | 1,099 × 634 pixels.
Original file (1,099 × 634 pixels, file size: 78 KB, MIME type: image/png)
File usage
The following file is a duplicate of this file (more details):
.png)
.png)
There are no pages that use this file.
.png&oldid=464078)
.png)
.png&action=edit&redlink=1)
.png&action=history)