Subjective well-being - statistics
Data extracted in October 2019
Planned article update: No update
Highlights
In 2018, average life satisfaction in the EU was highest in Ireland and Finland.
The average rating of life satisfaction in the EU increased between 2013 and 2018, with Bulgaria, Ireland and Cyprus recording the highest increases.
In 2018, financial situation, employment and social interactions played an important role for life satisfaction of the EU population.
The aim of this article is to capture well-being of European citizens based on the data collected for the 2018 ad-hoc module on subjective well-being, which is part of the European Union’s (EU’s) statistics on income and living conditions (EU-SILC) survey. The 2018 module covered some topics, which were previously collected for the 2013 ad-hoc module on the same subject. The data for 2018 is available for the 28 Member States as well as Norway and Switzerland.
Full article
Overall life satisfaction in the EU
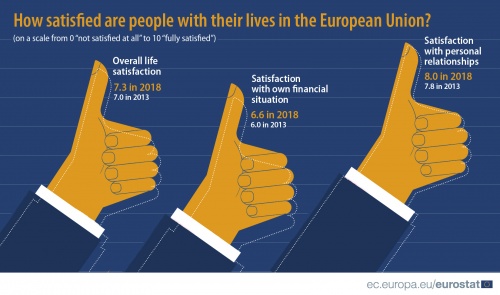
One of the most important aspects of subjective well-being is individuals’ satisfaction with life in general. In 2018, the rate of overall satisfaction with life in the EU-28 was at 7.3 on average on a scale from 0 (not at all satisfied) to 10 (completely satisfied).
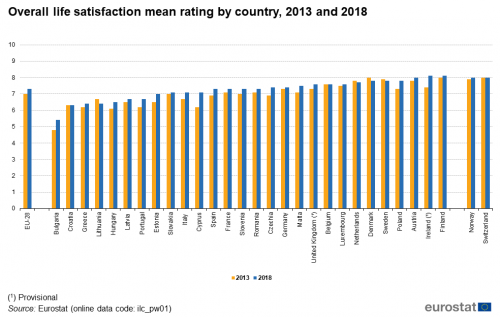
Figure 1 shows that in 2018 the highest mean satisfaction was in Ireland, Austria, Finland as well as Norway and Switzerland with value 8.0 or slightly larger. Average life satisfaction was the lowest in Bulgaria with a mean value of 5.4. Bulgaria was also the only country with an average rating smaller than 6.0. Other Member States reporting comparatively low mean ratings below the EU-28 average included Croatia, Greece, Lithuania, Hungary, Latvia and Portugal. It can be noted that there is of a regional pattern visible to some extent as northern and central EU Member States experience a higher average life satisfaction among their population than most of the eastern and southern states.
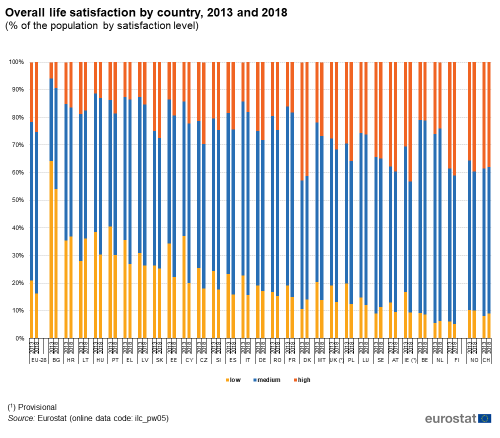
Aside from the mean satisfaction values, the shares of people rating their satisfaction level with rates that are grouped as low (0-5), medium (6-8) or high (9-10) differ significantly among Member States. In Bulgaria, 54 % of the population had a low life satisfaction in 2018, which is by far larger than in any other Member State, followed by Croatia at 36.8 % and Lithuania at 36.2 %. Furthermore, Bulgaria had the lowest percentage of highly satisfied individuals at only 9.5 %. Hungary and Greece also reported a low percentage of highly satisfied individuals at 13.1 % and 13.5 % respectively.
On the other hand, some countries have the score of high satisfaction ranking above 35 %, including Ireland with 43.2 %, Denmark with 41.3 %, Finland with 41.1 % followed by Austria as well as Norway at 39.7 %. The lowest share of inhabitants with a low level of satisfaction is in Finland and the Netherlands with 5.2 % and 6.3 % respectively. In total for the EU-28 16.2 % on average declare a low level of life satisfaction and 25.4 % a high level of life satisfaction.

Source: Eurostat (ilc_pw01) and (ilc_pw05)
In comparison to 2013, on the scale from 0 to 10, the average rating of life satisfaction in the EU-28 increased from 7.0 to 7.3 points. Figure 2 further indicates that most of the Member States have increased their average rating in the last 5 years. The largest increases can be found in Bulgaria, Ireland and Cyprus, by 0.6, 0.7 and 0.9 points respectively. At the same time, the average rating in Denmark, the Netherlands and Sweden decreased slightly, with the largest decrease in Lithuania by 0.3 points.
Source: Eurostat (ilc_pw01)
Figure 3 further reveals that these changes also apply to the distribution of low, medium and high shares of overall life satisfaction rates. Generally, there has been an improvement in the overall life satisfaction between 2013 and 2018 as most of the Member States recorded a decrease in shares of people having a low level of satisfaction and an increase in people being highly satisfied. For those Member States, the decrease in the shares of people with low levels of life satisfaction is larger than the increase in shares of people being highly satisfied. The largest decline in the shares of people with a low level of life satisfaction of more than 10 percentage points are visible in Bulgaria, Portugal and Estonia, with Cyprus recording the highest decrease of 17 percentage points. The largest increase in the shares of people being highly satisfied occur in Ireland with an increase of nearly 13 percentage points followed by Cyprus and Czechia with around 8 percentage points. While in most countries the share of respondents with low level of life satisfaction has decreased, in Lithuania, Denmark and Sweden the share of people with low levels of life satisfaction perceptibly increased by more than 8, 3 and 2 percentage points respectively, followed by a slight increase in Croatia of 1 percentage point.
Source: Eurostat Eurostat (ilc_pw05)
Younger people tend to report higher levels of life satisfaction
Apart from the differences between individual countries as outlined in the previous section, there are differences between single groups of the population. Socio-demographic factors like age, income and education have a strong influence on people’s living conditions and expectations and thus affect their satisfaction with life in general.
As indicated in Figure 4, life satisfaction decreases with age. Hence, the share of people with a low level of overall life satisfaction increases whereas the share of highly satisfied people decreases the older people become. In 2018, the EU-28 average rate of the youngest age group 16-24 was equal to 7.8 points. Around 9.5 % of the respondents in this age group declared a low level of life satisfaction and 34.5 % were highly satisfied. By contrast, people aged 75 and over had a mean rating of 6.9 and around 23.4 % had a low level of life satisfaction, and only 20.3 % had a high level of satisfaction. The age groups with the slightest difference in low and high levels of life satisfaction were those aged 50-64 and 65-74. Among them, around 19 % declared a low level of life satisfaction (18.8 % and 18.4 % respectively) around 24 % declared a high level of life satisfaction (22.4 % and 23.9 % respectively). For the first five age groups 16-74 years old the share of highly satisfied people is larger than the share of people with low level of life satisfaction, but for the oldest age group the pattern is reversed.

Source: Eurostat (ilc_pw01) and (ilc_pw05)
A link between education and life satisfaction
Figure 5 reveals that there is a link between educational attainment and the level of overall life satisfaction. The higher the level of educational attainment, the higher the average rating of overall life satisfaction in the EU Member States. The mean rating for people with tertiary education is about one point higher than the one for respondents whose highest educational level is lower secondary education (7.8 compared to 6.9). Additionally, the share of people with a low level of life satisfaction is reaching 24.0 % for those with lower secondary education only, but decreases to 8.6 % for respondents with tertiary education.

Source: Eurostat (ilc_pw01) and (ilc_pw05)
Marginal gender effects on life satisfaction
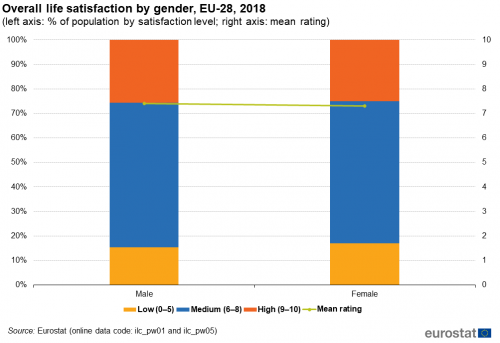
While there are differences between socio-demographic factors such as age and educational attainment, the difference between male and female respondents in the overall life satisfaction is not as pronounced. Figure 6 illustrates that the mean rating of life satisfaction in the EU-28 for 2018, for male respondents was 7.4 points, while for female respondents it was 7.3 points. When looking at low, medium and high shares of overall life satisfaction, the differences between men and women remain low. 15.3 % of male respondents stated that they have a low level of life satisfaction, in comparison to 17.0 % of females. On the other hand, 25.6 % of males and 25.2 % of females had a high rating of life satisfaction in 2018.
Source: Eurostat (ilc_pw01) and (ilc_pw05)
Life satisfaction and income
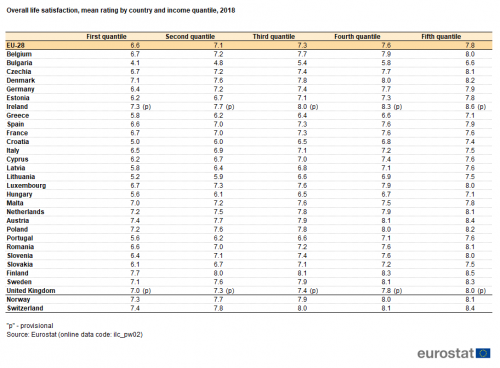
There is also a clear link between income quantile and overall life satisfaction. Table 1 highlights that this effect is evident in all the Member States as well as Switzerland and Norway. In the EU-28, in 2018, respondents in the lowest income quintile had an average life satisfaction rating of 6.6 points, followed by 7.1 points in the second quantile, 7.3 and 7.6 in the third and fourth quantiles, while the average life satisfaction in the fifth quantile reached as high as 7.8 points. As highlighted for the overall satisfaction rate, Austria, Finland and Ireland also had one of the highest scores with respondents in the fifth quantile rating their overall life satisfaction as high as 8.4, 8.5 and 8.6 points respectively, while Bulgaria had the lowest score with 6.6 points from respondents in the fifth quantile and 4.1 points from responents in the first quantile.
Source: Eurostat (ilc_pw02)
Life satisfaction is higher among couples with children
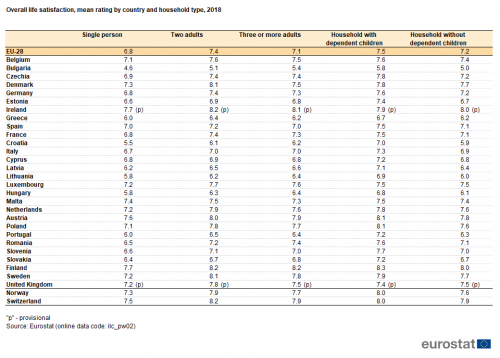
Household type of the respondent also affects the level of their overall life satisfaction. It appears that children have a positive impact on the overall satisfaction with life as respondents living in households with dependent children have the highest mean satisfaction rating equal to 7.5. On the other hand, people living in single households have the lowest level of satisfaction with a mean value of 6.8. As indicated by Table 2, overall this effect is visible in all the Member States as well as Switzerland and Norway with only some minor national specifities.
Source: Eurostat (ilc_pw02)
Satisfaction with the financial situation
Financial situation of the household is not only essential for a decent standard of living, but it also plays a crucial role in the overal satisfaction of life. Severe material deprivation, poverty and not being able to pursue a desired life hugely affects individuals' well-being. To measure how people feel about their financial situation in the EU Member States, in 2013 and 2018 respondents had to indicate how satisfied they are with their financial situation on a scale from 0 to 10.
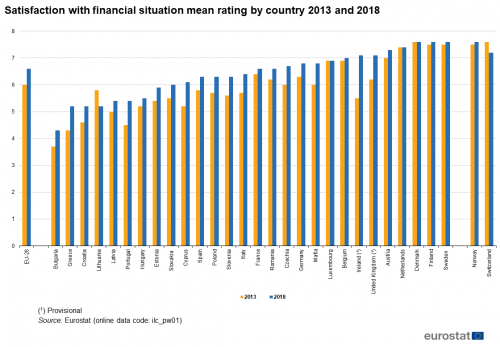
The EU-28 average rating for satisfaction with the financial situation equalled to 6.6 points in 2018 and was thus lower than the rate for overall life satisfaction, i.e. people on average are less satisfied with their financial situation than with their life in general. The mean ratings are 7.6 in Denmark, Finland and Sweden as well as Norway. Bulgaria had the lowest average rating with 4.3 points, significantly lower than that of the other EU countries followed by Greece, Croatia and Lithuania at 5.2 points. The gap between the mean values of the least and the most satisfied Member States with financial situation was as large as 3.3 points, thus larger than the gap for overall life satisfaction which is 2.7 points between Bulgaria and Finland. Nevertheless, Figure 7 highlights that the situation improved considerably compared to 2013 as the EU-28 average rating increased from 6.0 to 6.6. The largest increases can be found in Greece, Portugal, Cyprus and United Kingdom with Ireland as high as 1.6 points. On other hand, in the northern or central EU Member States, the increase in the mean value were only minor or values stayed at the same level with the exception of Germany with the higher increase. Lithuania is the only Member State reporting a decrease in the mean value compared to 2013, as well as Switzerland.
Source: Eurostat (ilc_pw01)
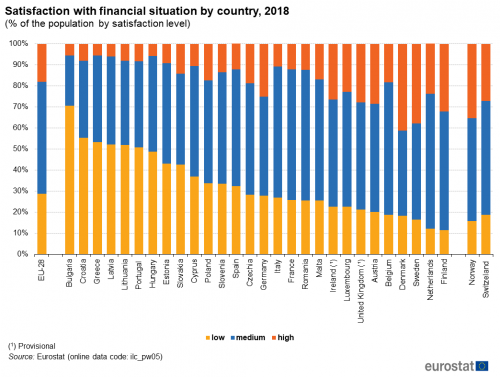
Aside from the mean satisfaction values, the shares of people rating their satisfaction with financial situation as high, medium or low vary among Member States. Similarly to overall life satisfaction, Bulgaria has the highest rate of low level of financial satisfaction, with 70.6 %, followed by Croatia and Greece with 55.4 % and 53.4 % respectively. On the other hand, 41.3 % of the respondents in Denmark and 37.7 % of the respondents in Sweden rate their satisfaction with financial situation as high and only 11.6 % of the respondents in Finland have a low level of satisfaction with their financial situation.
Source: Eurostat (ilc_pw05)
Job satisfaction
In addition to financial situation, employment typically takes an important role in one’s life as employed persons spend a great part of their lifetime at work. If people are satisfied with their job, they are able to realise their full potential and achieve personal goals, which positively affects their well-being. Therefore, measuring job satisfaction in the individual countries is of significant interest.
On average, European citizens rate their satisfaction with their job at 7.2 in 2018, more than half point higher than their satisfaction with financial situation and nearly the same as in 2013 where the EU-28 average was equal to 7.1. Figure 9 also reveals that the differences between Member States are much smaller than for overall life satisfaction and satisfaction with the financial situation. The highest mean satisfaction in 2018 occurs in Finland as well as in Norway with mean rating of 8.1, followed by Austria with a mean rating of 8.0 points. Denmark, Estonia, Sweden and Ireland have above-average mean values of 7.6, 7.7 and 7.8 points respectively. Mean ratings are the smallest in Greece and Bulgaria, slightly above 6.0, which are also the only Member States with mean values smaller than 7.0.
Satisfaction with personal relationships
Personal relationships also plays a significant part in life satisfaction. A well-functioning social environment offers an important balance between work and personal life and allows individuals to feel as part of a society. Good personal relationships also help to protect people from loneliness and promote their overall well-being.
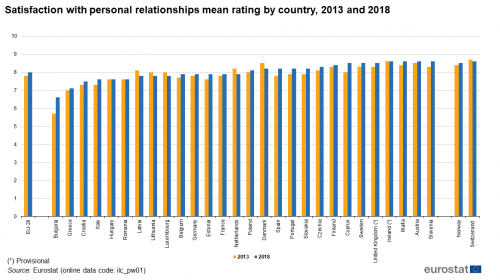
First of all, as shown in Figure 10, it is interesting to note that the mean values for satisfaction with personal relationships, are higher than any other satisfaction measured in the EU-SILC. Secondly, the regional pattern is much less visible than for other satisfactions as it is no longer as pronounced. Finally, the increase of the EU-28 average for satisfaction with personal relationships is more limited as it is equal to 8.0, in comparison to 7.8 in 2013. The highest values are present for Ireland, Malta, Austria and Slovenia as well as Switzerland with mean values of 8.6. Cyprus, Sweden, the United Kingdom as well as Norway have mean values equal to 8.5.
Nevertheless, the Member States with the lowest mean values remain the same as with other satisfactions. The lowest mean rating is in Bulgaria with 6.6 points significantly lower than the EU-28 average. It is followed by Greece with 7.1 and Croatia with 7.5 points. However, there has been an improvement since 2013 in all three countries, as the mean ratings for satisfaction with personal relationships increased, in particular in Bulgaria where it was 5.7 in 2013.
Source: Eurostat (ilc_pw01)
Frequency of being happy
Apart from measuring satisfactions, how individuals view their happiness highlights their emotional aspect of well-being and refers to their day-to-day feelings and moods. Measuring happiness is important because if people are happy, they perceive their life from a better perspective and are likely to feel more positive about other aspects in their life and this promotes their subjective well-being.
Usually, for these kind of measures, respondents are asked to think about their feelings lately (such as happiness or sadness) within a short time period. To measure people’s happiness, respondents in EU-SILC were asked to rank their frequency of being happy in the past four weeks on the following scale: ‘all of the time’, ‘most of the time’, ‘some of the time’, ‘a little of the time’ or ‘none of the time’.
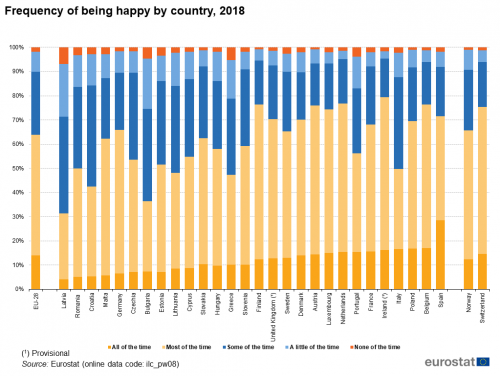
Figure 11 shows that in 2018 just over 60 % of the EU-28 population said that over the last four weeks they were happy all or most of the time, and nearly 14 % said they were happy all of the time. On the other hand, roughly, 10 % were happy only a little or none of the time. According to the results, the happiest individuals are in Ireland with 79 % of respondents happy all or most of the time together with Finland, Austria, the Netherlands and Belgium with close to 76 % of the respondents happy all or most of the time, while only about 5 % feeling happy a little or none of the time. Other countries among the happiest ones are Denmark, Luxembourg, France and Poland as well as Switzerland with close to 70 % happy all or most of the time. Spain recorded the highest share of people that were happy all of the time, with almost 29 %.
On the other hand, the frequency of being happy is the lowest in Latvia, Bulgaria, and Greece. In Latvia, nearly 30 % of the inhabitants were happy only a little or none of the time and the share of those being happy all or most of the time was only slightly larger than 30 %. Comparing these results to the previous analysis, there is a link between the frequency of being happy and satisfaction with life in general. Those countries that record the highest frequencies of being happy among their population are in general also the ones with the highest levels of overall life satisfaction and vice versa.
Conclusion
While overall life satisfaction provides an initial indication of one’s well-being and highlights the differences between EU Member States, factors such as income and education level attained provides a deeper insight on the perception of life in general. By and large it can be noted that subjective well-being of European citizens is quite high. Given all the satisfactions analysed for the EU-SILC data the mean rating of the EU Member States is above 6.0 and for satisfaction with personal relationships it reaches 8.0 points.
In comparison to 2013, mean values for all the categories increased and most of the individual countries were able to record an improvement or stabilisation of the average well-being of their population. Also in terms of the day-to-day-feelings of the population, measured by the frequency of being happy, the overall picture in the European Union is positive. However, as for 2013, there are patterns still visible among the regions. The subjective well-being of the population in terms of their happiness and satisfaction with different aspects of life is overall higher for the Nordic and central EU Member States than for people living in southern and eastern parts of the European Union. For the overall life satisfaction, satisfaction with financial situation as well as the frequency of being happy, the pattern is more pronounced than for job satisfaction and satisfaction with personal relationships as it varied significantly between EU Member States.
Finally, it can be noted that higher satisfaction with life correlates with a higher frequency of being happy, higher satisfaction with the financial situation and employment and to less extent with higher satisfaction with personal relationships. These results, thus, reveal that financial situation, employment and social interactions play an important role for the satisfaction of individuals across the EU and day-to-day feelings and moods are interrelated with subjective well-being.
Source data for tables and graphs
Data sources
An ad-hoc module on subjective well-being was initially implemented in the EU-SILC in 2013. The module contained subjective questions (e.g. How satisfied are you with your life these days?) which complement mostly objective indicators from existing data collections and social surveys. The module was implemented again in 2018 which included some of the same areas covered in 2013 such as overall life satisfaction, financial satisfaction and satisfaction with personal relationships.
Context
Life satisfaction
Life satisfaction represents how persons evaluate their life overall. It is a broad and reflective measure which covers all areas of one’s life. The concept therefore refers to the respondent’s opinion/feeling about how they evaluate their life and how they are feeling "these days" rather than specifying a longer or shorter time period. The aim is not to obtain the current emotional state of the respondent but to receive a reflective judgement on their level of satisfaction. While indicators like job satisfaction, satisfaction with the financial situation of the household or satisfaction with the accommodation address certain areas of life, general life satisfaction refers to the individual’s evaluation of all subjectively relevant life domains and is therefore considered as an overall measure for subjective well-being.
EU policies targeting subjective well-being
In the EU, a broad range of outcomes are considered when evaluating the objectives of social and economic policy including subjective measures of quality of life. Factors potentially affecting individuals quality of life range from education, employment to social relationships. Subjective well-being has a significant impact on individuals’ quality of life and enriches the measurement of people’s living conditions with a perspective that cannot be captured by objective indicators. By asking people about their satisfaction with different aspects of life and their happiness, it is possible to get a better sense of how Europeans perceive their life, whether there are differences among groups of the population within a country as well as differences between EU Member States. Using subjective indicators allows to understand the viewpoint of the people and to be aware of the problems faced by individuals across Europe not perceptible otherwise. These insights are helpful to take measures against inequalities arising in individual Member States and across the EU, at the same time pursuing one of the principal aims of the European Union - the promotion of the well-being of its citizens.
Well-being began to appear more explicitly in the EU policy agenda in 2006 when the Council of the European Union cited the well-being of present and future generations in its European Sustainable Development Strategy as its central goal. It became more transperant that GDP alone cannot ditinguish all the factors that boost overall well-being. Quality of life (QoL) is broader than economic output and living standards. It includes the full range of factors influencing what people value in life beyond its material aspects.
An ad-hoc module on subjective well-being was implemented in the 2013 EU-SILC and the results were published in 2015. Since 2015, a first set of QoL indicators, building mainly on existing data in the European Statistical System (ESS), have been published in the QoL dedicated section, followed by an analytical report on QoL oublished by Eurostat in 2016. The module was implemented again in 2018 and in the future, EU-SILC will eventually be developed further to serve as the core EU instrument linking the different dimensions of QoL.
Direct access to
Dedicated section
Publications
Methodology
- Income and living conditions (ESMS metadata file — ilc_esms)
- Main concepts and definitions
Legislation
- Regulation (EC) No 1177/2003 — framework regulation — this is the central piece of legislation which sets up the whole EU-SILC instrument
- Summaries of EU Legislation: EU statistics on income and living conditions
- Detailed list of legislative information on EU-SILC provisions for survey design, survey characteristics, data transmission and ad-hoc modules
