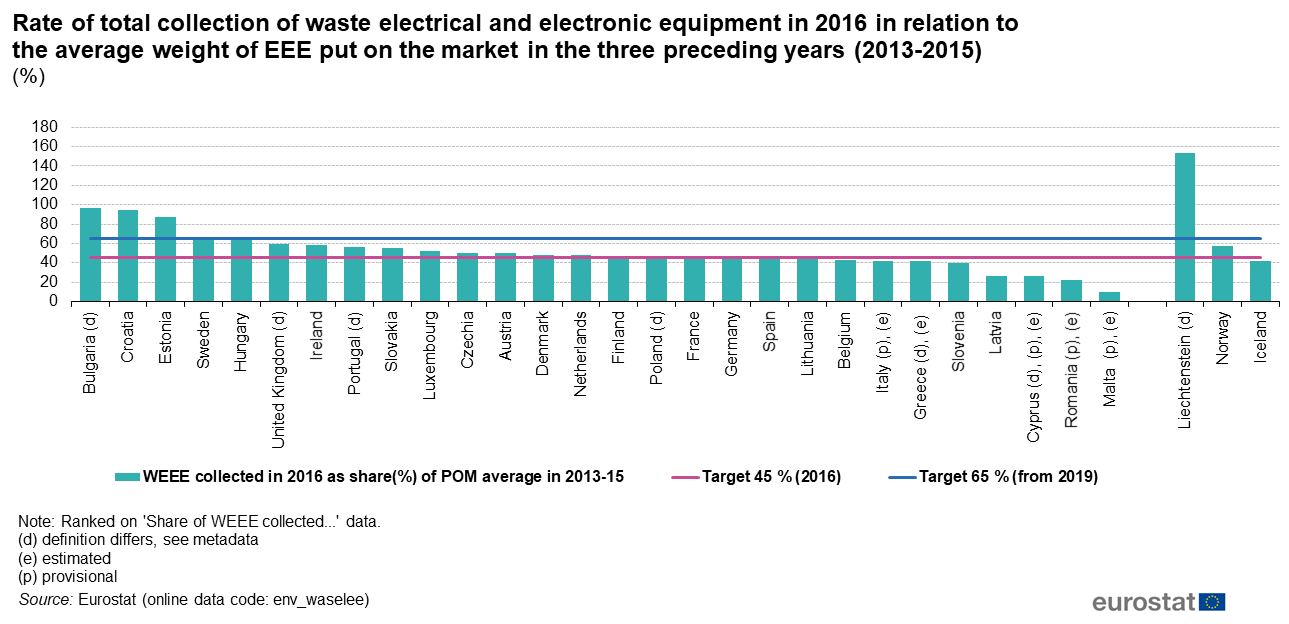
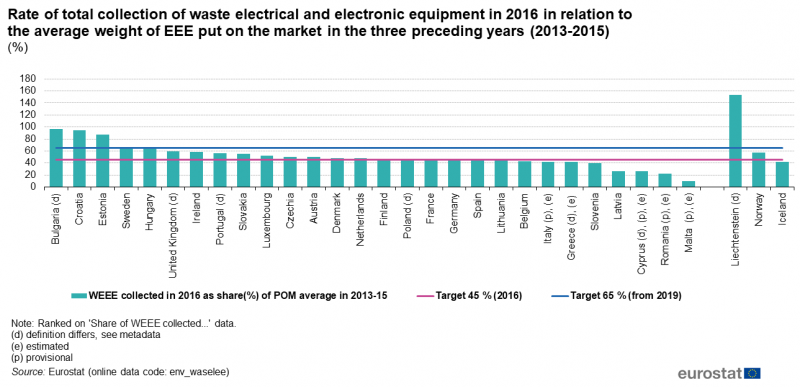
File:Figure 5 Rate of total collection for WEEE in 2016 in relation to the average weight of EEE POM 2013-2015 percentage.png
Revision as of 08:58, 6 August 2019 by Verdodo (talk | contribs) (Verdodo uploaded a new version of "File:Figure 5 Rate of total collection for WEEE in 2016 in relation to the average weight of EEE POM 2013-2015 percentage.png")
Size of this preview: 800 × 387 pixels. Other resolutions: 320 × 155 pixels | 1,289 × 624 pixels.
Original file (1,289 × 624 pixels, file size: 75 KB, MIME type: image/png)
title change
File usage
There are no pages that use this file.