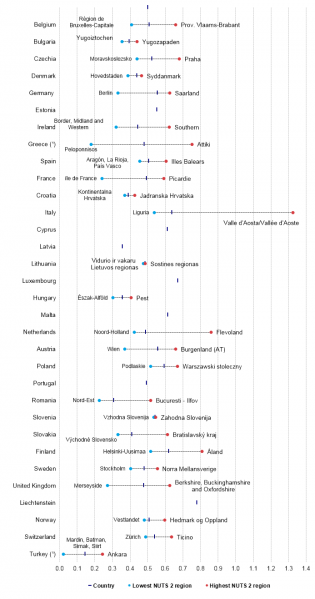
File:Figure 1 Regional disparities in the number of passenger cars per inhabitant, NUTS 2 level, 2017.png
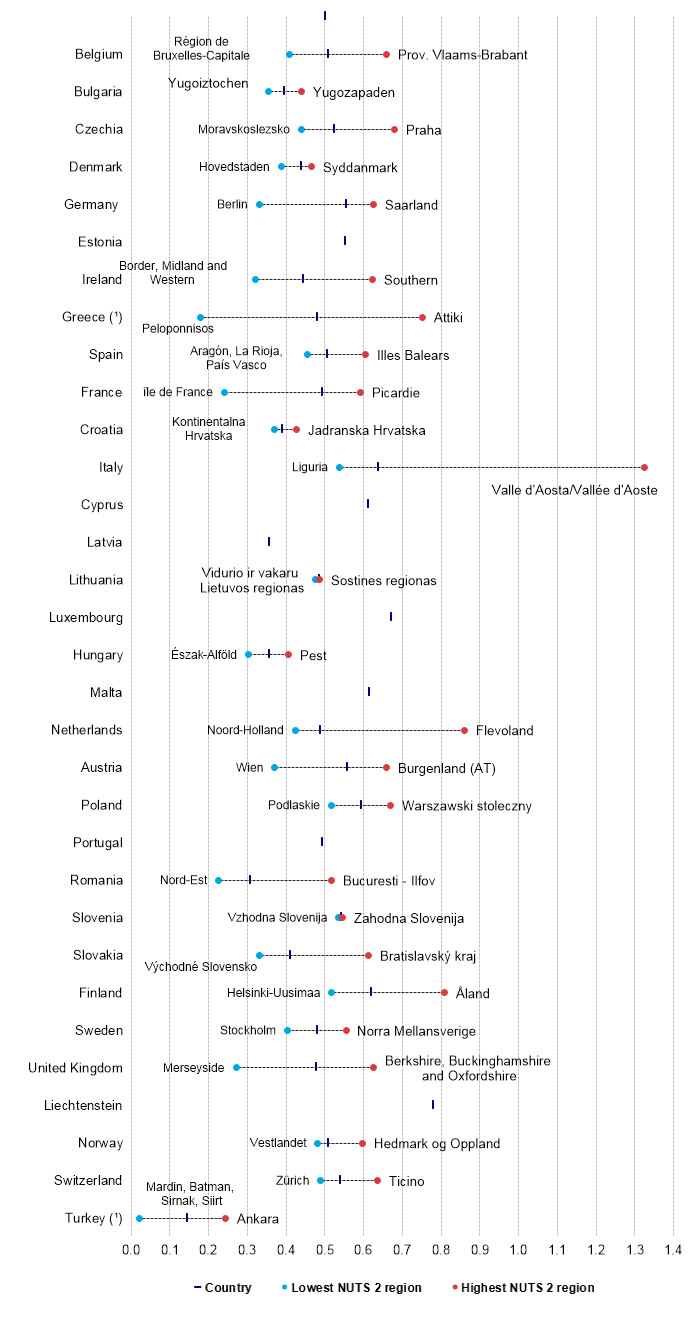
Size of this preview: 315 × 599 pixels. Other resolutions: 126 × 240 pixels | 693 × 1,317 pixels.
Original file (693 × 1,317 pixels, file size: 67 KB, MIME type: image/png)
File usage
There are no pages that use this file.