_relative_to_gross_domestic_product_(GDP),_by_NUTS_2_regions)_RYB19.png)
 relative to gross domestic product (GDP), by NUTS 2 regions) RYB19.png&body=Statistics Explained - Regions with the highest R & D intensities, 2016 (%, based on gross domestic expenditure on R & D (GERD) relative to gross domestic product (GDP), by NUTS 2 regions) RYB19.png %0A https%3A%2F%2Fec.europa.eu%2Feurostat%2Fstatistics-explained%2Findex.php%3Ftitle%3DFile%3ARegions_with_the_highest_R_%2526_D_intensities%2C_2016_%28%2525%2C_based_on_gross_domestic_expenditure_on_R_%2526_D_%28GERD%29_relative_to_gross_domestic_product_%28GDP%29%2C_by_NUTS_2_regions%29_RYB19.png)
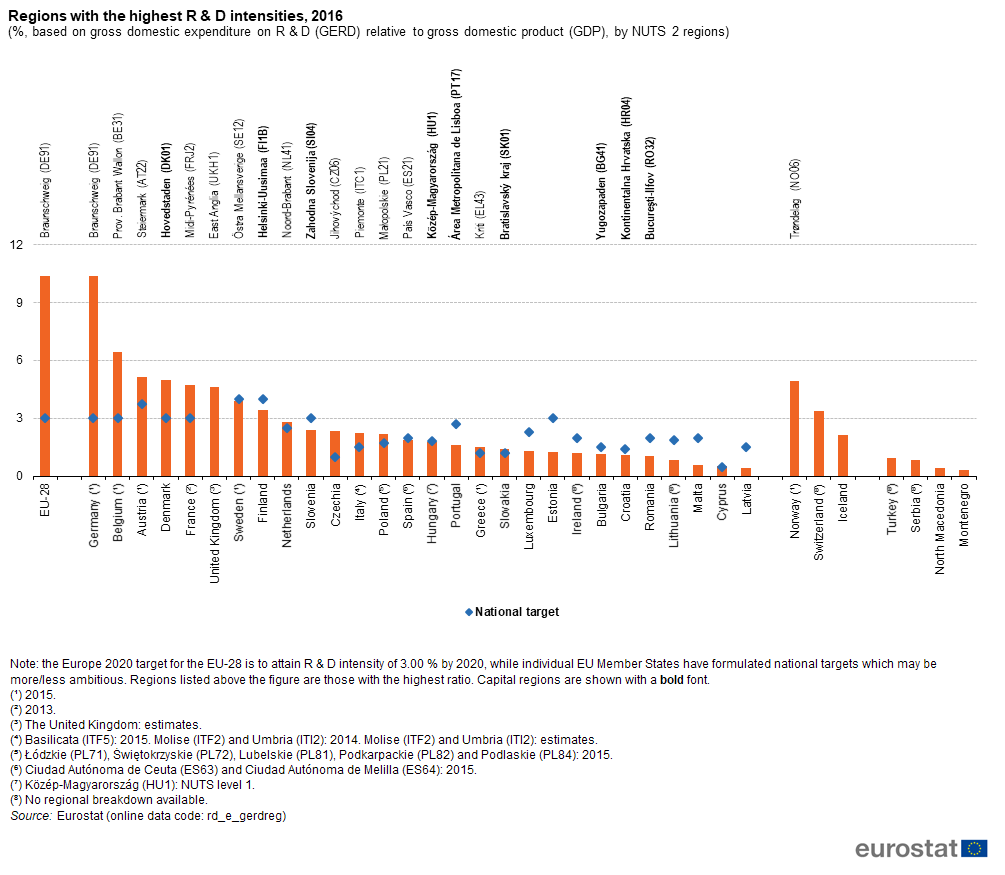
File:Regions with the highest R & D intensities, 2016 (%, based on gross domestic expenditure on R & D (GERD) relative to gross domestic product (GDP), by NUTS 2 regions) RYB19.png
Revision as of 12:06, 27 June 2019 by EXT-G-Albertone (talk | contribs)
Size of this preview: 689 × 600 pixels. Other resolutions: 276 × 240 pixels | 1,005 × 875 pixels.
Original file (1,005 × 875 pixels, file size: 73 KB, MIME type: image/png)
File usage
The following 2 pages use this file:
_relative_to_gross_domestic_product_(GDP),_by_NUTS_2_regions)_RYB19.png&oldid=439517)
_relative_to_gross_domestic_product_(GDP),_by_NUTS_2_regions)_RYB19.png)
_relative_to_gross_domestic_product_(GDP),_by_NUTS_2_regions)_RYB19.png&action=edit&redlink=1)
_relative_to_gross_domestic_product_(GDP),_by_NUTS_2_regions)_RYB19.png&action=history)