File:Distribution of holiday trips in the four quarters of 2009.png
Revision as of 16:15, 23 November 2010 by Dimitch (talk | contribs) (→Graph Map Table created with data from July 2010)
No higher resolution available.
Distribution_of_holiday_trips_in_the_four_quarters_of_2009.png (628 × 399 pixels, file size: 5 KB, MIME type: image/png)
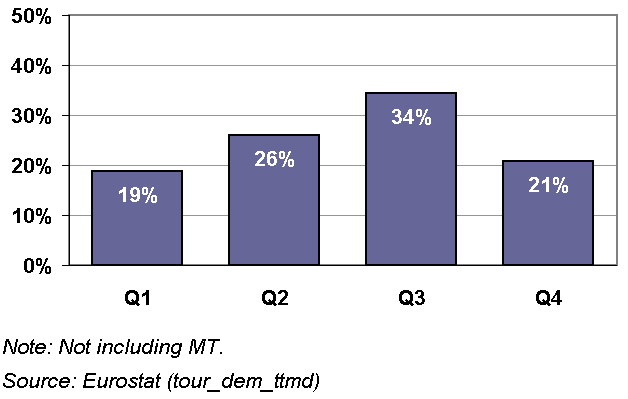
Distribution of holiday trips in the four quarters of 2009 [sum=100%], EU-27
Graph created with data from July 2010
Most recent data available now, see:
Number of trips - by month of departure - annual and quarterly data (tour_dem_ttmd)
File usage
There are no pages that use this file.