Archive:Employment rates – annual statistics
Data from April 2018.
Planned update of the article: April 2020.
Highlights
In 2018, the employment rate of persons aged 20-64 in the EU-28 was 73.2%, the highest rate recorded since 2005.
Thirteen EU Member States, four more than in 2017, reached their EU 2020 employment rate goal in 2018.
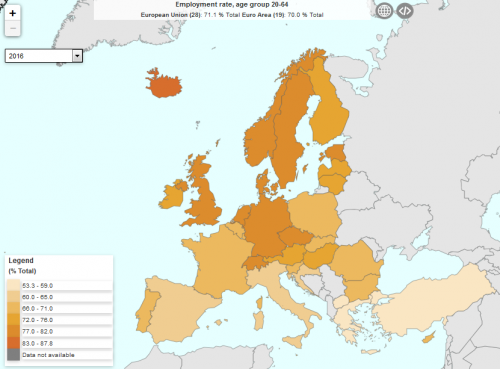 Map 1: Employment rates
Click on the map for an interactive view of the data.
Employment rate age group 20 to 64, EU-28, 2018
In 2010, the European Council adopted the Europe 2020 strategy [1]. The emphasis was on the reinforcement of the EU economy and on the preparation of challenges for the next decade. With regard to employment, the aim was to increase the employment rate of the population aged 20 to 64 years to at least 75% by 2020. In addition, the EU Member States set national targets for the employment rate in 2020.
This article provides more insight in the progression towards the EU and national targets of the Europe 2020 strategy related to the area of employment.
Overall, there has been a clear shift in the European labour market since 2005. In 2018 the EU-28 had the highest employment rate since 2005 and is progressing towards its 75% EU target. Moreover, almost half of the countries have already reached their national target. The gender employment gap has significantly decreased since 2005 and there has been a notable rise in employment for the female population as for the senior population.
Full article
Persistent increase of the employment rate at EU level
In 2018, the employment rate of persons aged 20-64 in the EU-28 reached 73.2%. This was the highest rate recorded since 2005. Exactly one decade before, in 2008, the financial crisis took place. In that year the employment rate was 70.2%, with a drop in rate the following years until 2013 (see Figure 1).
Since the adoption of the EU 2020 strategy in 2010, the employment rate has grown by almost 5 percentage points (4.7 p.p), with the most persistent growth since 2014. Indeed there is indeed a year-on-year growth of 1.0 percentage point on average since 2015. Recently, between 2017 and 2018, the rate also increased by 1.0 percentage point. With the 2018 results, the EU-28 is just 1.8 percentage points away from its 75% employment target.
.png)
Please note that the employment rate gives information on the share of the adult population who have a paid job (in other words, of the employed persons). They can be paid in cash or in kind and the person can have a job as an employee, as a self-employed person or as a family worker. In most cases, a paid job is an important indicator of the living standard of people and the employment rate mainly determines the socio-economic conditions of individuals in a country. Moreover, it provides key macroeconomic information as it describes to what extent human resources of a country are mobilized for economic purposes.
<sesection>
EU Member States compared
As shown on Map 1, there are notable differences in employment rate across EU Member States. In 2018, there was a difference of 23 percentage points between the country with the highest and the country with the lowest employment rate. Sweden, which is the only EU Member State with a employment rate above 80%, is at the top end with 82.6% while Greece is at the bottom end with 59.5%. Between these two extremes, three major groups of countries can be found: one with an employment rate ranging from 60 to 69.9%, one within the range of 70 to 74.9% and one within the range of 75 to 79.9%. Italy, Croatia, Spain, Belgium and Romania are part of the first group, while the second group consists out of France, Luxembourg, Poland, Bulgaria, Slovakia, Cyprus, Ireland and Hungary and the third group includes the remaining 13 EU Member States, namely Germany, Portugal, the Netherlands, the United Kingdom and the three Baltic countries.
Map 1: Employment rates
Click on the map for an interactive view of the data.
<sesection>
Thirteen EU Member States already reached their target
As mentioned before, one of the targets of the Europe 2020 strategy is to have an employment rate of at least 75% for persons aged 20 to 64 years. This objective has been translated into national targets that reflect the situation and possibilities of each EU Member State. The national targets vary considerably across countries, ranging from 62.9% in Croatia to 80.0% in Denmark, the Netherlands and Sweden. (see Figure 2).
In 2018, thirteen EU Member States have already reached or even exceeded their national target: Germany, Estonia, Ireland, Lithuania, Sweden, Czechia, Latvia, Malta, Croatia, Poland, Portugal, Slovenia and Slovakia. Five of them had already reached their target in 2015 and the number of countries reaching their goal is still expected to grow in a near future: Romania is only 0.1 percentage point away from its goal, and Luxembourg, the Netherlands, Austria and Hungary are less than one percentage point away from their target.

Nevertheless, countries who have already reached their goal, have followed different paths. Germany, Czechia and Malta are the only three countries that have had a steady upward movement over the last 14 years. Estonia, Ireland, Lithuania, Sweden, Latvia and Croatia have had ups and downs over the same period of time. Germany is the only country that has reached and kept its target since 2013. Sweden, while being one of the EU Member States with the highest national target, achieved its goal six years ahead of schedule, and continues to maintain this growing tendency in 2018.
France, Belgium, Bulgaria and Italy have had a fluctuating to slow increase of their employment rate over the last years. However, since the last two to three years they are less than 5 percentage points away from their target. Spain is the only country that is 5 to 10 percentage points below its target and has experienced notable fluctuations over the past 15 years. In addition, Greece is more than 10 percentage points below its target and has been so since 2011.
<sesection>
Gender employment gap shrinking, but still lasting
The gender gap in employment, as well as the employment rate of men and women in each country is shown for 2005 and 2018 in Figure 3. Countries are ranked based on the size of the gender employment gap in 2018 (by decreasing order). Among the EU Member States, Lithuania had the smallest and Malta the largest gender employment gap. The triangles/squares (for women) and the lines/crosses (for men) show the employment rate of the different years (2005 and 2018). The vertical length of the black line for each country indicates the difference between the employment rate of men and women (i.e. the gender employment gap). So, the longer the line between the values of men and women in the corresponding year, the larger the gender employment gap. The horizontal dotted line indicates the EU 2020 target.
.png)
For the EU-28, the gender employment gap has diminished in 2018 compared with 2005: from 16.0 to 11.5 percentage points. This decrease at EU-level is the result of the increase of the women's employment rate. During the last decade, the employment rate for men has practically been unchanged and stabilised.
Lithuania, Sweden, Estonia and Germany are the only EU Member States that have fulfilled the EU employment rate target (75%) for both men and women in 2018. In contrast, Belgium, Hungary, Spain, Italy and Greece have not achieved that goal, neither for men nor women.
In 2018 compared with 2005, Estonia, Poland, Hungary and Romania have an increase in the gender employment gap, while the majority of the EU Member States show a decrease. Although, over the same period of time, the majority of the EU Member States have increased rates for both sexes, there are some exceptions. Greece is the only EU Member State with a drop in employment rate for both men and women; Denmark, Luxembourg, Belgium, Cyprus, Spain, Ireland and Italy on the other hand show increased employment rates for women, but decreased employment rates for men. The decreasing employment gender gaps across countries can consequently be explained by the following two factors: (i) in one half of the EU Member States, this is due to the growing employment rate of both men and women, with a faster increase among women than among men, and (ii) in the other half of the countries, this is due to decreasing employment rates among men, with at the same time increasing rates among women.
<sesection>
More seniors in employment ...
The European Union has, in addition to the goal to increase the employment rate among women, the policy target to increase the employment rate of the senior population. From 2005 to 2018, the increase in employment rate is somehow proportional to the age (see in Figure 4a): among persons aged 60-64, the employment rate increased by 17.7 percentage points, while among those aged 20-24 it increased by 1.0 percentage point only.
Comparing the employment rate in 2018 with the Europe 2020 target at EU level, the six age groups between 25-54 years old are all equal or above the 75% EU target. The highest employment rate is recorded for the age group 40-44 years, at 83.1%. Since 2005, this age group correspond to the highest rate.
Similar conclusions can be drawn from figure 4b, where results in absolute numbers are shown.
.png)
.png)
<sesection>
... and also more people with high education level in employment
The evolution from 2005 to 2018 of the employment rate of women and men by level of education, at EU-level, shows increase for the medium and high education levels for both sexes (see Figure 5a). Women (resp. men) with medium education level recorded an increase of + 4.6 p.p. (resp. + 3.4 p.p.), and women (resp. men) with high education level recorded an increase of + 2.3 p.p. (resp. + 2.2 p.p.). The employment rate for women with low education level also slightly rose (+ 1.6 p.p) while the corresponding rate for men slightly decreased (- 1.8 p.p) over the same time period.
The employment rate of those with a high level of education remains the highest over the whole period 2005-2018, with an employment rate of 81.5% for women and even a rate of 88.2% for men with a high education level in 2018 in the EU-28.
In absolute numbers, persons with a medium level of education constituted the largest proportion of those in employment over the whole period 2005-2018 (see Figure 5b). In 2018 compared with 2005, the group of people in employment with a low level of education has decreased, while the group of people in employment with a high level of education has increased. Moreover, men with low education level corresponds to the most decreasing population group, and women with high education level is the most increasing group. In 2018, there is a clear shift within the group of men and women in employment with a high level of education; women outnumber men compared to the situation in 2005.
_.png)

<sesection>
Narrower gap between men and women with high education level
The employment rate for 2018 at EU-level is shown in Figure 6 by age group, sex and education level. Graphs are displayed from left to right for the low, medium and high level of education respectively. A clear pattern is visible: whatever the education level and the age group, the employment rate of men is always higher than the one of women. Nevertheless, the gender employment gap (indicated by black line in each graph for each age group) decreases with the increase of education level and is smaller for the people aged less than 30 years old. The gender employment gap is almost absent for those with a high education level aged 20-29 years (0.8 p.p difference between men and women for the age group 20-24 and 3.9 p.p for the age group 25-29). The group of people with a high education level aged 45-59 years also corresponds to a relatively small gender employment gap (5.6 p.p. difference between men and women for the age group 45-49, 4.9 p.p. for the age group 50-54 and 6.0 p.p. for the age group 55-59). On the opposite, the gender employment gap is the highest for people with low education level aged 25-44 years, with more than 23 p.p. difference between men and women employment rate for each of the four concerned 5-years age groups.
.png)
Source data for tables and graphs
Data sources
Source: The European Union Labour Force Survey (EU-LFS) is a large sample, quarterly survey providing results for the population in private households in the EU, EFTA and the candidate countries. Conscripts in military or community service are not included in the results.
Reference period: Yearly results are obtained as averages of the four quarters in the year.
Coverage:
France - since the first quarter of 2014 the overseas departments of Guadeloupe, Martinique, Guyane, and La Réunion are covered, in addition to the metropolitan territory. Overseas departments are included in the results of the detailed series, but not in the results of the main indicator.
Cyprus - the survey covers only the areas of Cyprus controlled by the Government of the Republic of Cyprus.
European aggregates: EU refers to the sum of EU-28 Member States and EA to the sum of the 19 euro area Member States. If data are unavailable for a country, the calculation of the corresponding aggregates takes into account the data for the same country for the most recent period available. Such cases are indicated.
Definitions: The concepts and definitions used in the survey follow the guidelines of the International Labour Organisation. Employment covers persons aged 15 years and over (16 and over in Spain, Italy and the United Kingdom, 15-74 years in Estonia, Latvia, Hungary, Finland, Sweden, Norway and Denmark, and 16-74 years in Iceland), living in private households, who during the reference week performed work, even for just one hour, for pay, profit or family gain, or were not at work but had a job or business from which they were temporarily absent, for example because of illness, holidays, industrial dispute or education and training. The LFS employment concept differs from national accounts domestic employment, as the latter sets no limit on age or type of household, and also includes the non-resident population contributing to GDP and conscripts in military or community service. Definitions of indicators reported in this publication are available on the EU-LFS Statistics Explained webpage: EU Labour Force Survey (Statistics Explained)
Context
Please note that Eurostat provides two sets of indicators linked to the annual employment rate, which serve different purposes and which in some cases differ from each other:
1) The main indicators, which are seasonally adjusted. They include the headline indicators under the EU2020 Strategy and are consequently used for monitoring the EU2020 targets (at EU and national levels). They have only a few breakdowns and normally refer to the age group 20-64. Please also note that for France the main indicators exclude overseas departments.
2) The detailed results, which are not seasonally adjusted. They have a large number of breakdowns and can therefore be used for more detailed analysis. These include the French overseas departments.
This article presents annual results for some indicators from the two sets described here above.
The article on Labour market and Labour force survey (LFS) statistics presents a series of other annual results of the LFS. For deeper insight into the labour market, this article should also be read together with Unemployment statistics and Underemployment and potential additional labour force statistics. The main source for the employment rate calculation is the labour force survey (LFS). The results from the survey currently cover all European Union Member States, the EFTA Member States of Iceland, Norway, Switzerland, as well as the candidate countries Turkey and the former Yugoslav Republic of Macedonia. The survey is based on the same target populations and uses the same definitions in all countries, which means that the results are comparable between the countries. Five different articles on detailed technical and methodological information is linked from the overview page EU labour force survey.
The EU-LFS is the largest European household sample survey providing quarterly and annual results on labour participation of people aged 15 and over as well as on persons outside the labour force. It covers residents in private households. The EU-LFS is an important source of information about the situation and trends in the national and EU labour markets.
Each quarter around 1.8 million interviews are conducted throughout the participating countries to obtain statistical information for some 100 variables. Due to the diversity of information and the large sample size the EU-LFS is also an important source for other European statistics like Education statistics or Regional statistics.
Direct access to