Archive:SDG 4 - Quality education (statistical annex)
Ensure inclusive and equitable quality education and promote lifelong learning opportunities for all (statistical annex)
Data extracted in August 2018
Planned article update: September 2019
Highlights
This article provides an overview of statistical data on SDG 4 ‘Quality education’ in the European Union (EU). It is based on the set of EU SDG indicators for monitoring of progress towards the UN Sustainable Development Goals (SDGs) in an EU context.
This article is part of a set of statistical articles, which are based on the Eurostat publication ’Sustainable development in the European Union — Monitoring report - 2018 edition’. This report is the second edition of Eurostat’s series of monitoring reports on sustainable development, which provide a quantitative assessment of progress of the EU towards the SDGs in an EU context.
Full article
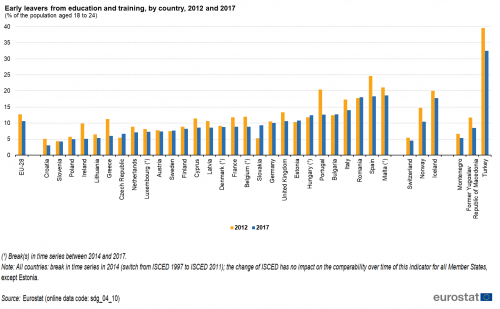
Early leavers from education and training
The indicator measures the share of the population aged 18 to 24 with at most lower secondary education who were not involved in any education or training during the four weeks preceding the survey. The data stem from the EU Labour Force Survey (EU-LFS).
Figure 1 shows that the phenomenon of early school leaving is becoming less and less prevalent in the EU. The share of early leavers from education and training fell by an average of 3.1 % per year between 2002 and 2017. In the short-term period, the average annual decrease was even stronger, at 3.6 %, which represents a considerable progress towards the ET 2020 benchmark of 10 %. The gender gap has also narrowed, by an average of 1.6 % per year between 2002 and 2017 and 2.3 % between 2012 and 2017.

Source: Eurostat (sdg_04_10)

Source: Eurostat (sdg_04_10)
Participation in early childhood education
The indicator measures the share of children between the age of four and the starting age of compulsory primary education who participated in early childhood education. Data presented here stem from the joint UIS (UNESCO Institute of Statistics)/OECD/Eurostat (UOE) questionnaires on education statistics, which constitute the core database on education.
Figure 3 shows that participation in ECEC has grown more or less continuously in the EU between 2001 and 2016, by 0.7 % per year on average. The increase has been less pronounced in the short-term period since 2011, at 0.5 % on average per year, but nonetheless participation in early childhood education has already reached its target of 95 % four years in advance.

Source: Eurostat (sdg_04_30)

Source: Eurostat (sdg_04_30)
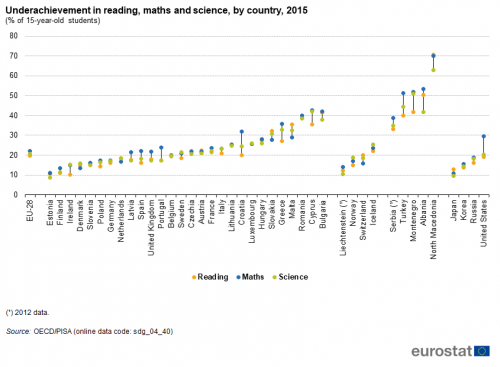
Underachievement in reading, maths and science
The indicator measures the share of 15-year-old students failing to reach level 2 (‘basic skills level’) on the Programme for International Student Assessment (PISA) scale for the three core school subjects of reading, mathematics and science. The data stem from the PISA study, a triennial international survey that aims to evaluate education systems by testing the skills and knowledge of 15-year-old students.
As shown in Figure 5 the rate of underachievement in reading has more or less stagnated around 20 % since 2000. In the short-term period since 2009 all three domains show a stagnation or a development in the wrong direction, meaning that the EU is not on track to meeting its 2020 target of 15 %.

Source: OECD/PISA (sdg_04_40)

Source: OECD/PISA (sdg_04_40)
Tertiary educational attainment
The indicator measures the share of the population aged 30 to 34 who have successfully completed tertiary studies (for example university, higher technical institution). Tertiary educational attainment refers to ISCED (International Standard Classification of Education) 2011 levels 5-8 for data from 2014 onwards and to ISCED 1997 levels 5-6 for data up to 2013. The indicator is based on the EU Labour Force Survey (EU-LFS).
Figure 7 shows that the tertiary educational attainment rate has increased consistently between 2002 and 2017, by 3.6 % per year on average. The increase has been less pronounced in the short-term period since 2012, with an average annual increase of 2.1 %, but is still well on track to reach the target of 40 % in 2020. The gender gap, however, has been widening by an annual average of 11.7 % between 2002 and 2017 and of 3.5 % between 2012 and 2017.

Source: Eurostat (sdg_04_20)

Source: Eurostat (sdg_04_20)
Employment rate of recent graduates
The employment rate of recent graduates is defined as the percentage of the population aged 20 to 34 with at least upper-secondary education (ISCED 2011 levels 3 to 8) who are in employment, not in any education and training, during the four weeks preceding the survey, and who have successfully completed their highest educational attainment one to three years before the survey. The data stem from the EU Labour Force Survey (EU-LFS).
As shown in Figure 9, the employment rate of recent graduates fell from 2008 to 2013, resulting in an average annual increase of only 0.1 % between 2006 and 2017. In the short-term period, the rate increased by 1.1 % per year on average, and is on track to meeting the 2020 target of 82 %. Moreover, the gender gap narrowed by an annual average of 2.6 % between 2006 and 2017 and of 4.4 % between 2012 and 2017.

Source: Eurostat (sdg_04_50)

Source: Eurostat (sdg_04_50)
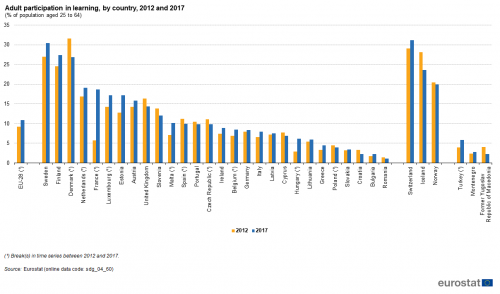
Adult participation in learning
Adult participation in learning refers to people aged 25 to 64 who stated that they received formal or non-formal education and training in the four weeks preceding the survey (numerator). The denominator consists of the total population of the same age group, excluding those who did not answer to the question ‘participation in education and training’. Adult education covers formal and non-formal learning activities — both general and vocational — undertaken by adults after leaving initial education and training [1]. Data stem from the EU Labour Force Survey (EU-LFS).
Figure 11 shows adult participation in learning over the past few years has stagnated. The average annual growth rate between 2002 and 2017 amounts to 2.9 %, but this development has been heavily influenced by a methodological change in the French Labour Force Survey in 2013 [2]. The short-term growth between 2013 and 2017 amounts to just 0.5 % per year on average, which is not fast enough to reach the target of 15 % by 2020.

Source: Eurostat (sdg_04_60)

Source: Eurostat (sdg_04_60)
Direct access to
More detailed information on EU SDG indicators for monitoring of progress towards the UN Sustainable Development Goals (SDGs), such as indicator relevance, definitions, methodological notes, background and potential linkages, can be found in the introduction of the publication ’Sustainable development in the European Union — Monitoring report - 2018 edition’.
Notes
- ↑ The general definition of adult learning covers formal, non-formal and informal training but the indicator adult participation in learning only covers formal and non-formal education and training. For more information, see: Eurostat, Participation in education and training.
- ↑ INSEE, the French Statistical Office, carried out an extensive revision of the questionnaire of the Labour Force Survey. The new questionnaire was used from 1 January 2013 onwards. It has a significant effect on the level of various French LFS-indicators.


