File:Migration flows by ctz group.png
No higher resolution available.
Migration_flows_by_ctz_group.png (696 × 440 pixels, file size: 4 KB, MIME type: image/png)
Title of graph, map or table, including last reference period
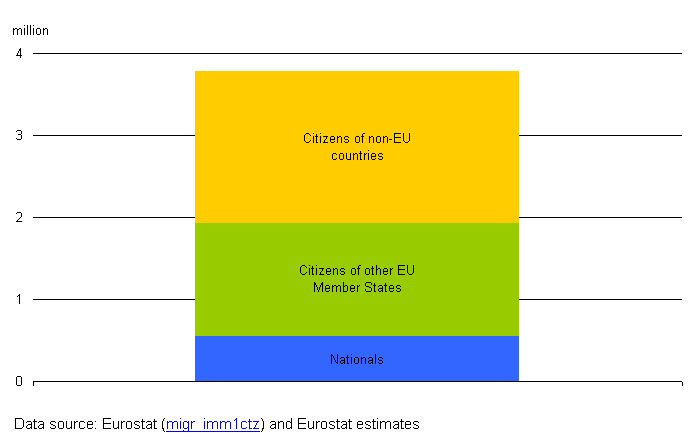
Total migration flows by main citizenship group, EU-27, 2008
Graph Map Table created with data from Month Year
October 2010
Most recent data available now, see:
Immigration by sex, age group and citizenship (MIGR_IMM1CTZ)
File usage
There are no pages that use this file.