Archive:SDG 11 - Sustainable cities and communities (statistical annex)
Make cities and human settlements inclusive, safe, resilient and sustainable (statistical annex)
- Data extracted in August 2018. Most recent data: Further Eurostat information, Main tables and Database. Planned article update: September 2019.
This article provides an overview of statistical data on SDG 11 ‘Sustainable cities and communities’ in the European Union (EU). It is based on the set of EU SDG indicators for monitoring of progress towards the UN Sustainable Development Goals (SDGs) in an EU context.
This article is part of a set of statistical articles, which are based on the Eurostat publication ’Sustainable development in the European Union — Monitoring report - 2018 edition’. This report is the second edition of Eurostat’s series of monitoring reports on sustainable development, which provide a quantitative assessment of progress of the EU towards the SDGs in an EU context.
Overcrowding rate

Source: Eurostat (sdg_11_10)

Source: Eurostat (sdg_11_10)
This indicator measures the share of people living in overcrowded conditions in the EU. A person is considered to be living in an overcrowded household if the house does not have at least one room for the entire household as well as a room for a couple, for each single person above 18, for a pair of teenagers (12 to 17 years of age) of the same sex, for each teenager of different sex and for a pair of children (under 12 years of age). The data stem from the EU Statistics on Income and Living Conditions (EU-SILC).
As shown in Figure 1, fewer and fewer people in the EU are living in overcrowded conditions. Between 2005 and 2016, the overcrowding rate fell by 1.6 % on average per year (EU-27). Progress has slowed in the short-term, with an annual average decrease of 0.5 % between 2011 and 2016.
Population living in households considering that they suffer from noise
Source: Eurostat (sdg_11_20)
Source: Eurostat (sdg_11_20)
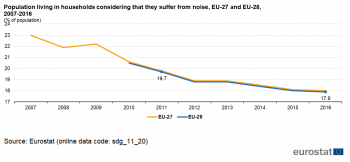
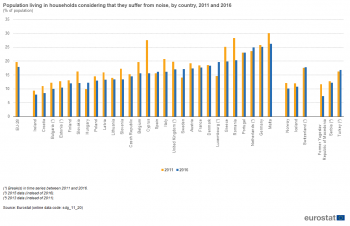
This indicator measures the proportion of the population who declare they are affected either by noise from neighbours or from the street. Because the assessment of noise pollution is subjective, an increase in the value of the indicator may not necessarily indicate a similar increase in noise pollution levels but also a decrease in the levels that European citizens are willing to tolerate and vice versa. The data stem from the EU Statistics on Income and Living Conditions (EU-SILC).
Figure 3 shows that the proportion of the EU population considering that they suffer from noise from neighbours or from the street declined by 1.9 % on average per year between 2011 and 2016.
Exposure to air pollution by particulate matter
Source: Eurostat (sdg_11_50)
Source: Eurostat (sdg_11_50)
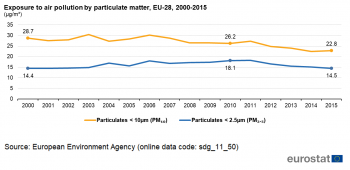
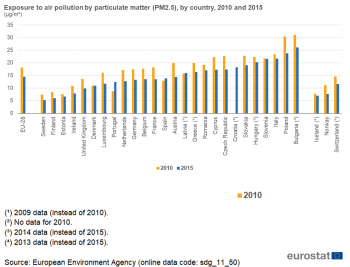
The indicator measures the population weighted annual mean concentration of particulate matter at urban background stations in agglomerations. Fine and coarse particulates (PM10) are less than 10 micrometers in diameter and can be carried deep into the lungs where they can cause inflammation and exacerbate the condition of people suffering from heart and lung diseases. Fine particulates (PM2.5) are less than 2.5 micrometers in diameter and are therefore a subset of the PM10 particles. Their negative health impacts are more serious than PM10 because they can be drawn further into the lungs and may be more toxic. Based on the annual submissions of Member States’ measured concentrations, the data are processed by the European Environment Agency (EEA), assisted by the Topic Centre on Air Pollution and Climate Change Mitigation (ETC/ACM).
As shown in Figure 5, air quality in the EU in terms of the more dangerous fine particulates (PM2.5) has not improved over the past 15 years. The concentration of PM2.5 increased between 2000 and 2015 by 0.05 % on average per year. In the short term the concentration declined annually by 4.3 % on average.
Difficulty in accessing public transport

Source: Eurostat (sdg_11_30)
The indicator measures the share of population reporting high or very high level of difficulty in accessing public transport. The data stem from the EU Statistics on Income and Living Conditions (EU-SILC). No time series can be presented as EU-SILC data on difficulty in access to public transport were collected in 2012 only.
Across EU countries, the share of the population reporting very high or high difficulty in gaining access to public transport in 2012 ranged from 9.8 % to 30.8 %, with an EU average of 20.4 %. Among other factors, country variations tend to reflect differences in population density, investment in transport infrastructure and urban sprawl.
People killed in road accidents
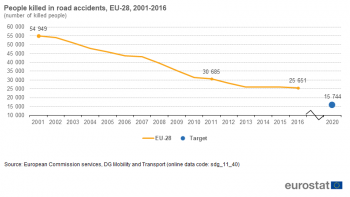
Source: Eurostat (sdg_11_40)
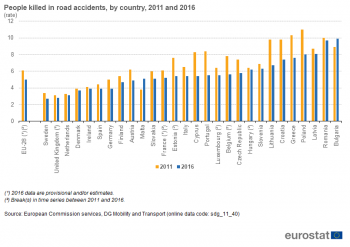
Source: Eurostat (sdg_11_40)
This indicator measures the number of fatalities caused by road accidents, including drivers and passengers of motorised vehicles and pedal cycles as well as pedestrians. People who die from injuries up to 30 days after being involved in a road accident are counted as road accident fatalities. After these 30 days, the reason for dying might be declared differently. For Member States not using this definition, corrective factors were applied. The data come from the CARE database managed by DG Mobility and Transport (DG MOVE).
As shown in Figure 8, the progress made in reducing the number of people killed in road accidents has slowed in recent years. While in the long term since 2001 the number has declined annually by 5.0 % on average, deaths due to road accidents have only fallen by 3.5 % on average per year since 2011. The stagnation in road casualties since 2013 has pushed the EU off track from its target of halving the number of road fatalities by 2020 compared to 2010 levels.
Recycling rate of municipal waste
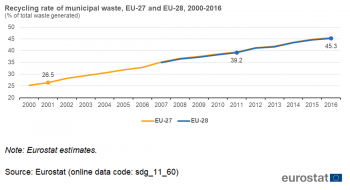
Source: Eurostat (sdg_11_60)

Source: Eurostat (sdg_11_60)
This indicator measures the amount of municipal waste recycled divided by the total municipal waste. Recycling includes material recycling, composting and anaerobic digestion. Municipal waste consists mostly of waste generated by households, but may also include similar wastes generated by small businesses and public institutions and collected by the municipality. This latter part of municipal waste may vary from municipality to municipality and from country to country, depending on the local waste management system. For areas not covered by a municipal waste collection scheme, the amount of waste generated is estimated. Member States report the amount of waste recycled and the total municipal waste generated each year to Eurostat.
As shown in Figure 10, recycling of municipal waste in the EU has increased strongly. The recycling rate of municipal waste has increased by 3.7 % per year on average over the long term and by 2.9 % on average in the short term.
See also
Further Eurostat information
Database
- Socioeconomic Development
Dedicated section
Methodology
More detailed information on EU SDG indicators for monitoring of progress towards the UN Sustainable Development Goals (SDGs), such as indicator relevance, definitions, methodological notes, background and potential linkages, can be found in the introduction of the publication ’Sustainable development in the European Union — Monitoring report - 2018 edition’.


