File:NUTS 3 regions classified as more urban in comparison to the original OECD typology.PNG

Size of this preview: 485 × 599 pixels. Other resolutions: 194 × 240 pixels | 687 × 849 pixels.
Original file (687 × 849 pixels, file size: 183 KB, MIME type: image/png)
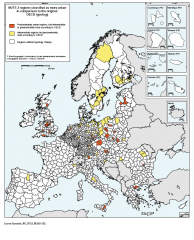
NUTS 3 regions classified as more urban in comparison to the original OECD typology
Map created with data from March 2010
File usage
There are no pages that use this file.