-RYB18.png)
-RYB18.png&body=Statistics Explained - Share of population and population change in metropolitan regions, 2016 and 2006-2016 (% and % per annum)-RYB18.png %0A https%3A%2F%2Fec.europa.eu%2Feurostat%2Fstatistics-explained%2Findex.php%3Ftitle%3DFile%3AShare_of_population_and_population_change_in_metropolitan_regions%2C_2016_and_2006-2016_%28%2525_and_%2525_per_annum%29-RYB18.png)
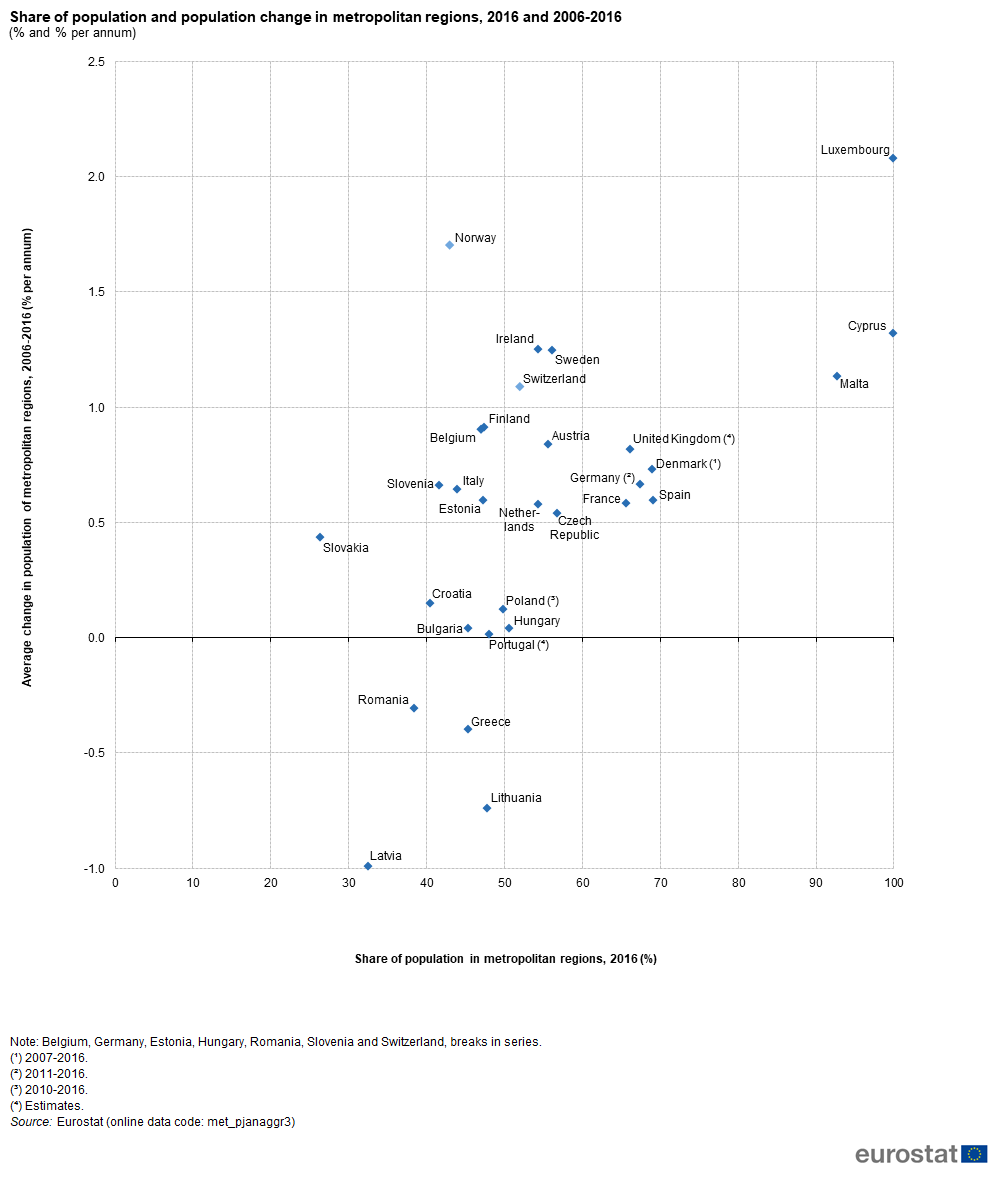
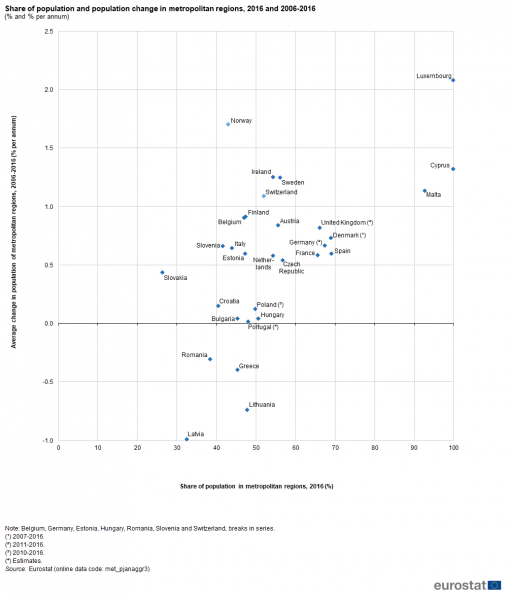
File:Share of population and population change in metropolitan regions, 2016 and 2006-2016 (% and % per annum)-RYB18.png
Revision as of 17:23, 28 June 2018 by EXT-A-Redpath (talk | contribs)
Size of this preview: 510 × 599 pixels. Other resolutions: 204 × 240 pixels | 1,005 × 1,181 pixels.
Original file (1,005 × 1,181 pixels, file size: 60 KB, MIME type: image/png)
-RYB18.png&oldid=392198)
-RYB18.png)
-RYB18.png&action=edit&redlink=1)
-RYB18.png&action=history)