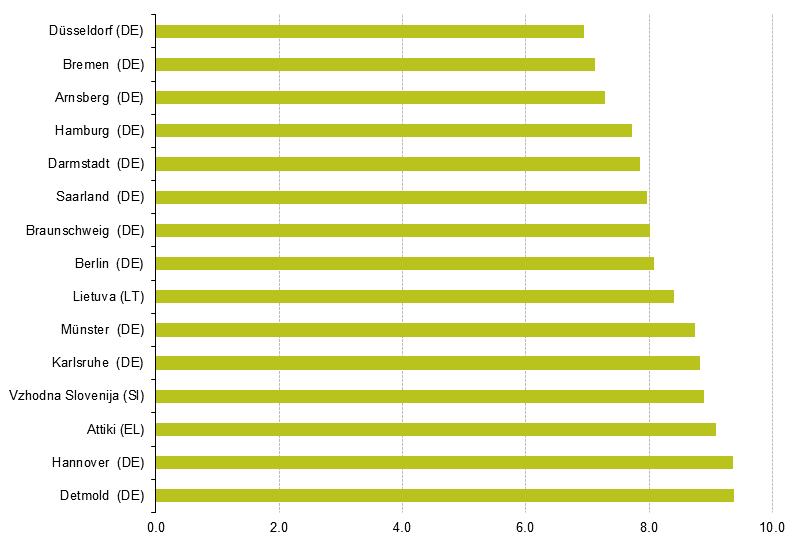
File:Fig 5 Lowest shares of utility vehicles in the total number of vehicles, by NUTS 2 EU-28 regions, 2016.PNG
No higher resolution available.
Fig_5_Lowest_shares_of_utility_vehicles_in_the_total_number_of_vehicles,_by_NUTS_2_EU-28_regions,_2016.PNG (800 × 545 pixels, file size: 12 KB, MIME type: image/png)
File usage
There are no pages that use this file.