Archive:Sustainable development - public health
- Data from July 2009, most recent data: Further Eurostat information, Database.
This article provides an overview of statistical data on sustainable development in the area of Public Health. They are based on the set of sustainable development indicators the European Union agreed upon for monitoring its sustainable development strategy. Together with similar indicators for other areas, they make up the report 'Sustainable development in the European Union - 2009 monitoring report of the EU sustainable development strategy', which Eurostat draws up every two years to provide an objective statistical picture of progress towards the goals and objectives set by the EU sustainable development strategy and which underpins the European Commission’s report on its implementation. More detailed information on public health indicators, such as indicator relevance, definitions, methodological notes, background and potential linkages, can be found on page 173-193 of abovementioned publication.
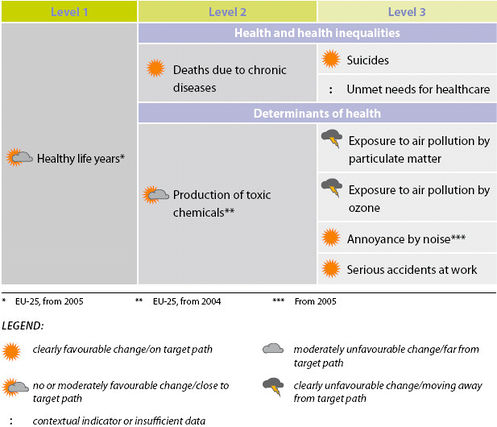
The table below summarizes the state of affairs of in the area of public health. Quantitative rules applied consistently across indicators, and visualized through weather symbols, provide a relative assessment of whether Europe is moving in the right direction, and at a sufficient pace, given the objectives and targets defined in the strategy.
Overview of main changes
The developments in the public health theme present a rather inconsistent picture. On the one hand, the headline indicator shows that people are not only living longer, but also living longer in good health. Improvements are also visible in reductions in deaths due to chronic diseases, suicides, annoyance by noise, and serious accidents at work. On the other hand, data clearly show that there remain challenges ahead related to the environmental determinants of health. Since 2000 people in the EU have been more exposed to ozone as well as to particulate matter. Nevertheless, the production of toxic chemicals, which has long been on an unfavourable path, has recently started to develop in a more favourable direction.
Main statistical findings
Headline indicators
Healthy life years
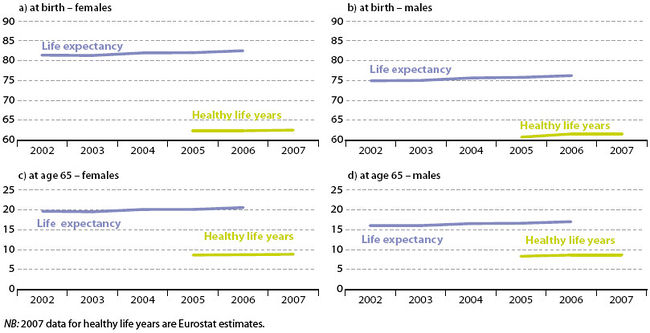
The number of years that men and women in the EU-25 are expected to live in a healthy condition has increased slightly between 2005 and 2007. A child born in 2006 would be expected to live 62 years free of disability and for 65-year-olds there is an expectation of a further nine years in good health
Life expectancy at birth is six years higher for women than men, but at the age of 65 the difference is 3½ years
Although the average life expectancy at birth is some six years higher for women than men, a child of either sex born in 2006 would be expected to live, on average, 62 years free of disability. For 65-year-olds, there is an expectation of a further nine years in good health, and the difference in life expectancy between the sexes has fallen to three-and-a-half years.
The gap between women and men is narrowing
EU-25 life expectancies at birth grew at an annual average rate of 0.3 % for women and 0.4 % for men over the period 2002 to 2006, women reaching 82.4 years and men 76.3 years in 2006. The growth rates at age 65 were somewhat higher, representing 1.2 % on average for women and 1.5 % for men, from 2002 to 2006. The differential between the female and the male growth rate has narrowed the gap between the two sexes.
Healthy life years are growing faster than life expectancy both at birth and at age 65 for men, whilst the contrary is true for women. Healthy life years at birth in the EU 25 grew at 0.2 % per year on average for females, compared to 0.7 % for males over the period 2005 to 2007.
Health and health inequalities
Deaths due to chronic diseases
Between 2000 and 2006, deaths due to chronic diseases have significantly fallen for under 65s in the EU-27
'Deaths due to chronic diseases have been steadily decreasing'

The majority of the population in high and middle income countries dies from chronic diseases. In the population aged under 65 years, deaths due to chronic diseases occur much less frequently than in the older population but still account for nearly 60 % of all deaths. The trend of deaths due to chronic diseases in the population aged less than 65 years has developed favourably between 2000 and 2006. They have decreased by 1.9 % per year in the EU-27 and at a slightly higher pace (2.0 %) in the EU-15. However, the average decline in the EU-15 has slowed down compared to the previous six years (1994-2000), when it was 2.4 % per year.
Deaths due to chronic diseases are almost twice as common for men than for women, but the gap has slowly narrowed between 2000 and 2006 (average annual declines: 2.1 % men, 1.7 % women). One reason for the closing gap could be the increasing efforts at both national and Community level to promote healthier lifestyles, such as healthy eating, taking regular exercise, better managing stress and avoiding harmful habits such as smoking and alcohol consumption.
Suicides
Suicide deaths have significantly declined between 2000 and 2006 in the EU 27. While progress has been seen amongst the youngest and, especially, the oldest age groups, the suicide rate has risen slightly in the 50-54 age group

Suicide rates vary between age groups
The suicide death rate is an indicator of mental health. Overall, it declined favourably in the EU-27 between 2000 and 2006 by an annual average of 2.2 %, although there are differences across age groups. While in the EU-27 suicides in the young group aged 15-19 years and particularly in the oldest group aged over 85 years have fallen by 2.8 % and 4.8 % per year respectively, a countertrend among people aged 50-54 years can be observed. In this age group suicide deaths have slightly risen by 0.5 % per year on average.
Suicide is more common amongst men than women
Suicide death rates vary not only across age groups but also between the sexes, and are roughly three times more common amongst men than women in the young and middle-age group and five times more common in the oldest age group. However, the gap between men and women is closing as suicides by men have been declining at a faster pace.
Strong variations between Member States
The rates and their developments also vary considerably across Member States. While many of the northern and north-eastern Member States show the highest rates, there have also been substantial declines in most of these countries. However, in some Member States suicides tended to increase since 2000.
Unmet needs for healthcare
The share of people reporting that they could not afford a medical examination or treatment is higher in the lower income groups, which is indicative of inequalities in access to health care between income groups
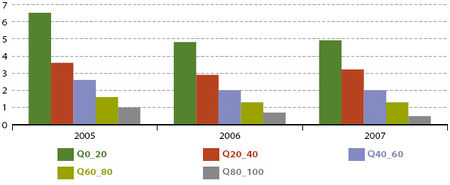
The cost of medical treatment is an obstacle to the poorest people in some Member States
This indicator highlights the inequalities in access to medical care across income classes. Less than 1 % of the highest income group perceive themselves as unable to afford a medical examination or treatment when they need it. In general this is also the case at the Member State level. As income decreases the proportion of those who consider expense as an obstacle to seeking medical care increases. The extent of this gradient across income groups varies considerably by country. It is negligible in Denmark, Slovenia and the UK and rather high in Latvia, Portugal and Romania.
Although changes in the questionnaire between the annual surveys in some Member States prevent the evaluation of progress in this indicator over time, the gradient across income groups is consistent throughout the survey period.
Global surface average temperature
The global average temperature in 2008 was 0.7 °C higher than a century and a half ago
The global surface average temperature increased by 0.7 °C over the last century
The year 2008 was among the ten warmest on record since systematic instrumental measurements began in around 1850, although slightly cooler than previous years of this century.
According to the World Meteorological Organization statement on the status of the global climate in 2008, ‘since the beginning of the twentieth century, the global average surface temperature has risen by 0.74 °C, although this increase has not been continuous. The linear warming trend over the past 50 years (0.13 °C per decade) is nearly twice that for the past 100 years’. Nevertheless, there are indications that over the past decade the global temperature rise has slowed down [1].
The Intergovernmental Panel of Climate Change (IPCC) consider that ‘there is high agreement and much evidence that with current climate change mitigation policies and related sustainable development practices, global greenhouse gas emissions will continue to grow over the next few decades’. According to all of its scenarios, the IPCC projects that the rise in temperature over the 21st century will very likely be larger than the rise over the 20th century [2].
Energy
Energy dependency
EU-27 energy dependency has risen steeply since 2000 and the level of around 55 % in 2008 is significantly higher than during the 1990s
More than half of EU energy is imported
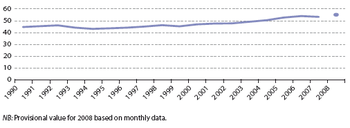
Energy dependency shows the extent to which an economy relies upon imports in order to meet its energy needs. Despite annual fluctuations, EU-27 dependency on imported energy remained rather constant throughout the 1990s, at a level of around 45 %. Since 2000, however, the level of dependency has grown, exceeding 50 % in 2004 and reaching a level of about 55 % (based on provisional data) in 2008. This represents a degree of dependence 10 percentage points higher than the average of the previous decade.
Apart from the growing demand for energy, the larger share of natural gas which is imported from outside the European Union and declining oil reserves in the North Sea have contributed to this development.
Gross inland energy consumption
The EU’s energy demand has grown moderately. Between 2000 and 2007 EU-27 energy consumption grew faster than in the previous decade, although since 2003 it has levelled off . There has been a general shift away from solid fuels towards natural gas and to some extent renewable energies
Energy consumption has grown since 2000 but has shown signs of stabilising over recent years. An overall shift away from solid fuels towards natural gas and renewable energies has taken place
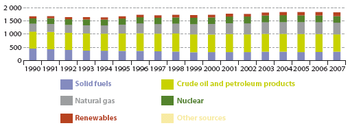
Gross inland energy consumption presented an average annual growth of 0.7 % between 2000 and 2007, slightly higher than the rate of 0.4 % in the previous decade. However, since 2003 energy consumption has levelled off . Overall, there has been a shift away from solid fuels, which represented about 27 % of the total consumption in 1990 and only about 18 % in 2007. This shift has been predominantly in favour of natural gas, rising from 18 % to 24 % over the same period, and, to a lesser extent, nuclear energy (rising from 12 % to 13 %) and renewable energies (rising from 4 % to 8 %). The share of crude oil and petroleum products decreased slightly from 38 % in 1990 to 36 % in 2007.
The rise in energy demand of about 80 million tonnes of oil equivalent between 2000 and 2007 mainly involved an increase of about 40 million tonnes of oil equivalent of both natural gas and renewable energies. While solid fuels also increased by about 10 million tonnes of oil equivalent, this was compensated by a decrease in crude oil and petroleum products, and nuclear energy.
Electricity generation from renewables
The share of renewables in electricity production increased from 13.8 % in 2000 to 15.6 % in 2007 in the EU-27, but remains below the path to the 2010 target of 21 %
Capacity of renewable electricity generation needs to speed up to meet 2010 target

Between 2000 and 2007, the contribution of electricity from biomass, hydro, wind, geothermal and solar energy increased progressively, reaching 15.6 % in 2007. After a decline during the early years of the decade, the annual growth rate is now substantially higher than during the 1990s. Between 2006 and 2007 the share of renewables grew by 1.0 percentage point. However, reaching the 21 % share by 2010 would require almost double of this rate.
Relatively long lead times for power generation investments may partially explain the previous slow progress. Prices for renewable energies, which for some technologies remain higher than conventional power generation, may also contribute to limit the speed of growth. In addition, regulatory barriers, such as difficulties in obtaining planning permission or grid access, persist in many Member States (see Commission communication Renewable energy road map. Renewable energies in the 21st century: Building a more sustainable future, COM(2006) 848).
Consumption of biofuels in transport
Biofuels are a small but rapidly growing energy source for transport. Their consumption has shown accelerated growth since 2000 and reached a share of 2.6 % in 2007 in EU-27. However, despite this growth their share remains below the target path
If growth in biofuels continues, the targets will probably be met

Between 1990 and 2000 the EU-27 share of biofuels in the petrol and diesel consumption of transport increased from zero to 0.24 %. From 2000 to 2007 the growth rate has increased leading to a share of 2.6 % in 2007.
Even though in 2007 the share of biofuels remains well below the target path, the current rate of growth would be sufficient to reach the 5.75 % target by 2010 as well as the binding 10 % target by 2020.
Combined heat and power
The uptake of combined heat and power, or cogeneration, has increased between 2004 and 2007, reaching 10.9 % of gross electricity generation in the EU-27
Combined heat and power generation has increased moderately since 2004

Despite the small decrease in 2006, the share of combined heat and power in total EU-27 electricity generation rose by 0.4 percentage points between 2004 and 2007 to 10.9 %. Although a longer time series for EU-15 is also shown in Graph 17, these data should be treated with caution due to changes in the calculation methodology over time.
According to the Energy Efficiency Action Plan, several barriers prevent expansion of capacity. These include the lack of district heating networks in many areas.
Implicit tax rate on energy
The implicit tax rate on energy fell by about 4 % between 2000 and 2007. Although this decrease in the effective tax burden on energy is inconsistent with the EU objective to shift taxation from labour onto resource and energy use, there are also indications that taxation may have stimulated energy saving
The implicit tax rate on energy has fallen since 2000

The ratio of energy tax revenues to final energy consumption represents the effective tax burden on energy. The decreases in the implicit tax rate show a decline in the effective tax burden on energy relative to the potentially taxable base. This is not consistent with the Sustainable Development Strategy’s principle of shifting taxation from labour onto resource and energy consumption. Nevertheless, there is some evidence that the previously high energy taxation has stimulated improvements in energy efficiency and has therefore helped to conserve energy. There has also been a greater reliance on policy instruments other than taxes, such as emissions trading. It is also true that energy taxes were reduced to compensate for the substantial rise in the oil price over recent years (see Taxation trends in the European Union, pp. 123-124).
Further Eurostat information
Publications
- Sustainable development in the European Union - 2009 monitoring report of the EU sustainable development strategy
- Energy, transport and environment indicators - Pocketbook, 2009
- Panorama of energy: Energy statistics to support EU policies and solutions - Statistical book, 2009
Database
- Indicators
- Climate Change and Energy
Dedicated section
Other information
- Commission communication, Promotion of the use of energy from renewable sources (Renewable Energy Directive), COM(2009) 28
- Commission communication, 20 20 by 2020: Europe’s climate change opportunity, COM(2008) 30
- Commission communication, An energy policy for Europe, COM(2007) 1
- Commission communication Energy efficiency: delivering the 20 % target, COM(2008) 772
- Commission Staff Working Document, The renewable energy progress report, SEC(2009) 503
- Green Paper - A European Strategy for Sustainable, Competitive and Secure Energy, European Commission, COM/2006/0105 final
- White paper - Adapting to climate change : towards a European framework for action, European Commission, COM/2009/0147 final
- Energy and environment report 2008, European Environment Agency, Report No 6/2008
- Greenhouse gas emission trends and projections in Europe 2008: Tracking progress towards Kyoto targets, European Environment Agency, Report No 5/2008
- International Energy Agency, World energy outlook 2009, IEA, Paris, 2009, in press
- Pachauri, R.K and Reisinger, A. (eds.), Climate Change 2007: Synthesis Report. Contribution of Working Groups I, II and III to the Fourth Assessment Report of the Intergovernmental Panel on Climate Change, IPCC, Geneva, 2007
- Rummukainen, M. and Källén, E., New climate science 2006-2009. A brief review of research into the physical science basis of the climate change issue since IPCC AR4/WG I of 2007, The Commission on Sustainable Development, Stockholm, 2009
- Stern, N.H., The economics of climate change: the Stern review, Cambridge University Press, Cambridge, 2007*Directive 2009/28/EC of 23 April 2009on the promotion of the use of energy from renewable sources(Renewable Energy Directive)
External links
See also
- All articles on sustainable development indicators
- Climate change statistics
- Energy production and imports
Notes
- ↑ European Council, Review of the EU Sustainable Development Strategy (EU SDS) - Renewed Strategy, op. cit., p. 3): ‘... promote sustainable consumption andfckLRproduction to break the link between economic growth and environmental degradation’.
- ↑ Pachauri, R.K and Reisinger, A. (eds.), Climate Change 2007: Synthesis Report. Contribution of Working Groups I, II and III to the Fourth Assessment Report of the Intergovernmental Panel on Climate Change, IPCC, Geneva, 2007, pp.44-5.
