.png)
.png&body=Statistics Explained - Aquaculture production, EU-28, Iceland, Norway and Turkey, 2008 and 2015 (tonnes of live weight and % of total fisheries production).png %0A https%3A%2F%2Fec.europa.eu%2Feurostat%2Fstatistics-explained%2Findex.php%3Ftitle%3DFile%3AAquaculture_production%2C_EU-28%2C_Iceland%2C_Norway_and_Turkey%2C_2008_and_2015_%28tonnes_of_live_weight_and_%2525_of_total_fisheries_production%29.png)
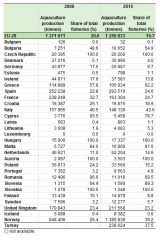
File:Aquaculture production, EU-28, Iceland, Norway and Turkey, 2008 and 2015 (tonnes of live weight and % of total fisheries production).png
Revision as of 10:10, 8 December 2017 by Fortiro (talk | contribs) (Fortiro uploaded a new version of "File:Aquaculture production, EU-28, Iceland, Norway and Turkey, 2008 and 2015 (tonnes of live weight and % of total fisheries production).png")
.png)
.png&diff=prev&oldid=365890)
.png&direction=prev&oldid=365890)

Size of this preview: 399 × 599 pixels. Other resolutions: 160 × 240 pixels | 441 × 662 pixels.
Original file (441 × 662 pixels, file size: 32 KB, MIME type: image/png)
File usage
The following page uses this file:
.png&oldid=365890)
.png&action=edit&redlink=1)
.png&action=history)