,_1990_and_2010,_EU-27.png)
, 1990 and 2010, EU-27.png&body=Statistics Explained - Ammonia emissions from agriculture (kilotonnes and %), 1990 and 2010, EU-27.png %0A https%3A%2F%2Fec.europa.eu%2Feurostat%2Fstatistics-explained%2Findex.php%3Ftitle%3DFile%3AAmmonia_emissions_from_agriculture_%28kilotonnes_and_%2525%29%2C_1990_and_2010%2C_EU-27.png)
File:Ammonia emissions from agriculture (kilotonnes and %), 1990 and 2010, EU-27.png
Revision as of 15:42, 6 November 2017 by Rosswen (talk | contribs) (Rosswen uploaded a new version of "File:Ammonia emissions from agriculture (kilotonnes and %), 1990 and 2010, EU-27.png")
,_1990_and_2010,_EU-27.png)
,_1990_and_2010,_EU-27.png&diff=prev&oldid=358837)
,_1990_and_2010,_EU-27.png&direction=prev&oldid=358837)
Size of this preview: 429 × 599 pixels. Other resolutions: 172 × 240 pixels | 506 × 707 pixels.
Original file (506 × 707 pixels, file size: 29 KB, MIME type: image/png)
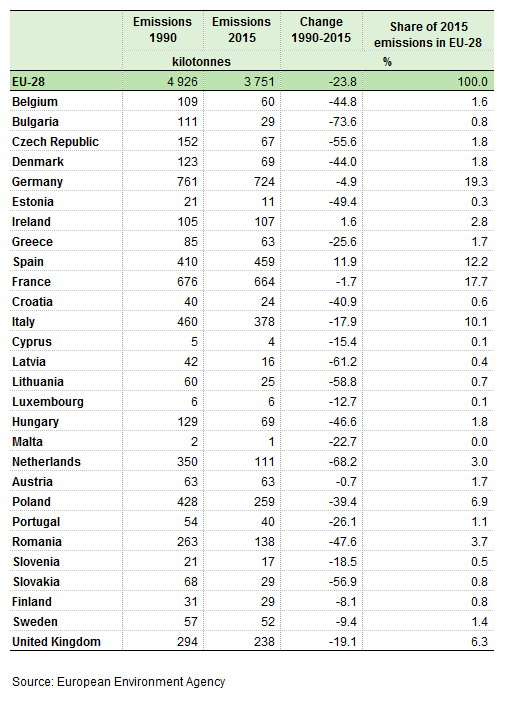
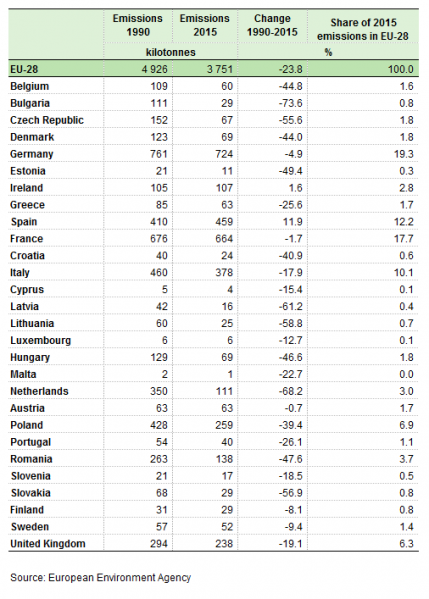
Ammonia emissions from agriculture (kilotonnes and %), 1990 and 2015, EU-28
Graph created with data from 1990 and 2015.
Data extracted in September 2017. Most recent data available at:
http://www.eea.europa.eu/data-and-maps/data/data-viewers/air-emissions-viewer-lrtap
File usage
The following page uses this file:
,_1990_and_2010,_EU-27.png&oldid=358837)
,_1990_and_2010,_EU-27.png&action=edit&redlink=1)
,_1990_and_2010,_EU-27.png&action=history)