_YB17.png)
 YB17.png&body=Statistics Explained - Main categories of taxes and social contributions, EU-28, 2006–2016 (% of GDP) YB17.png %0A https%3A%2F%2Fec.europa.eu%2Feurostat%2Fstatistics-explained%2Findex.php%3Ftitle%3DFile%3AMain_categories_of_taxes_and_social_contributions%2C_EU-28%2C_2006%25E2%2580%25932016_%28%2525_of_GDP%29_YB17.png)
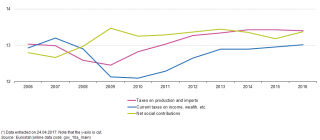
File:Main categories of taxes and social contributions, EU-28, 2006–2016 (% of GDP) YB17.png
Revision as of 17:14, 23 October 2017 by Diamari (talk | contribs) (Diamari uploaded a new version of "File:Main categories of taxes and social contributions, EU-28, 2006–2016 (% of GDP) YB17.png")
_YB17.png)
_YB17.png&diff=prev&oldid=357177)
_YB17.png&direction=prev&oldid=357177)
_YB17.png&diff=cur&oldid=357177)
_YB17.png&direction=next&oldid=357177)
_YB17.png&diff=next&oldid=357177)

Size of this preview: 800 × 349 pixels. Other resolutions: 320 × 140 pixels | 1,008 × 440 pixels.
Original file (1,008 × 440 pixels, file size: 21 KB, MIME type: image/png)
File usage
There are no pages that use this file.
_YB17.png&oldid=357177)
_YB17.png&action=edit&redlink=1)
_YB17.png&action=history)