_bis.png)
 bis.png&body=Statistics Explained - T1 Aquaculture production, EU-28, Iceland, Norway and Turkey, 2008 and 2015 (tonnes of live weight and % of total fisheries production) bis.png %0A https%3A%2F%2Fec.europa.eu%2Feurostat%2Fstatistics-explained%2Findex.php%3Ftitle%3DFile%3AT1_Aquaculture_production%2C_EU-28%2C_Iceland%2C_Norway_and_Turkey%2C_2008_and_2015_%28tonnes_of_live_weight_and_%2525_of_total_fisheries_production%29_bis.png)
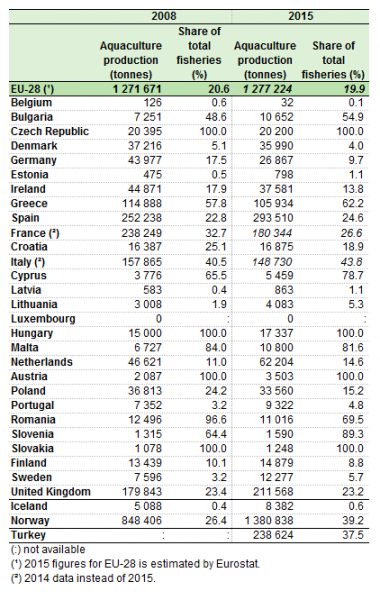
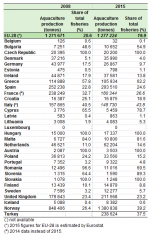
File:T1 Aquaculture production, EU-28, Iceland, Norway and Turkey, 2008 and 2015 (tonnes of live weight and % of total fisheries production) bis.png

Size of this preview: 380 × 600 pixels. Other resolutions: 152 × 240 pixels | 422 × 666 pixels.
Original file (422 × 666 pixels, file size: 33 KB, MIME type: image/png)
File usage
There are no pages that use this file.
_bis.png&oldid=355522)
_bis.png)
_bis.png&action=edit&redlink=1)
_bis.png&action=history)