Archive:EU-ASEAN cooperation - key trade and investment statistics
Revision as of 12:26, 30 May 2017 by EXT-S-Allen (talk | contribs)
- Data extracted in March and April 2017. Most recent data: Further Eurostat information, Database.
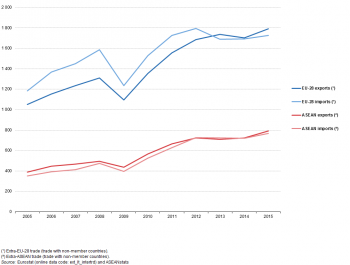
Figure 1: Development of international trade in goods, 2005–2015
(billion EUR)
Source: Eurostat (ext_lt_intertrd) and ASEANstats
(billion EUR)
Source: Eurostat (ext_lt_intertrd) and ASEANstats
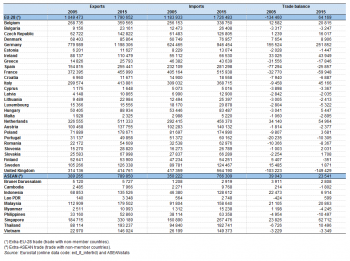
Table 1: International trade in goods, 2005 and 2015
(million EUR)
Source: Eurostat (ext_lt_intertrd) and ASEANstats
(million EUR)
Source: Eurostat (ext_lt_intertrd) and ASEANstats
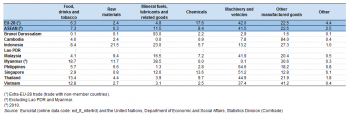
Table 2: Exports by broad group of goods, 2015
(%)
Source: Eurostat (ext_lt_intertrd) and the United Nations, Department of Economic and Social Affairs, Statistics Division (Comtrade)
(%)
Source: Eurostat (ext_lt_intertrd) and the United Nations, Department of Economic and Social Affairs, Statistics Division (Comtrade)
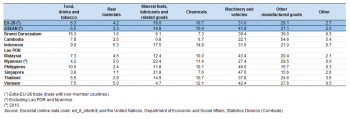
Table 3: Imports by broad group of goods, 2015
(%)
Source: Eurostat (ext_lt_intertrd) and the United Nations, Department of Economic and Social Affairs, Statistics Division (Comtrade)
(%)
Source: Eurostat (ext_lt_intertrd) and the United Nations, Department of Economic and Social Affairs, Statistics Division (Comtrade)
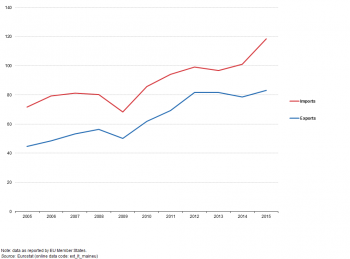
Figure 2: Development of international trade in goods with ASEAN, EU-28, 2005–2015
(billion EUR)
Source: Eurostat (ext_lt_maineu)
(billion EUR)
Source: Eurostat (ext_lt_maineu)

Table 4: International trade in goods with ASEAN Member States, EU-28, 2005 and 2015
(million EUR)
Source: Eurostat (ext_lt_maineu)
(million EUR)
Source: Eurostat (ext_lt_maineu)
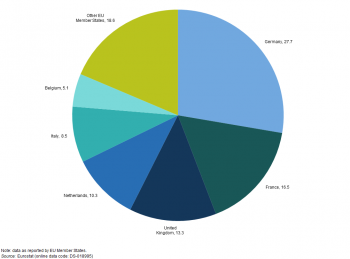
Figure 3: Origin of EU-28 exports of goods to ASEAN, 2015
(% share of EU-28 exports to ASEAN)
Source: Eurostat (DS-018995)
(% share of EU-28 exports to ASEAN)
Source: Eurostat (DS-018995)
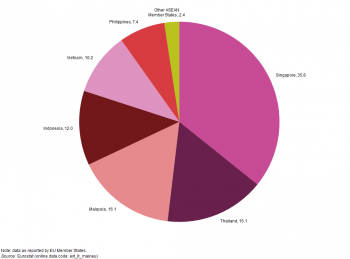
Figure 4: Destination of EU-28 exports of goods to ASEAN, 2015
(% share of EU-28 exports to ASEAN)
Source: Eurostat (ext_lt_maineu)
(% share of EU-28 exports to ASEAN)
Source: Eurostat (ext_lt_maineu)
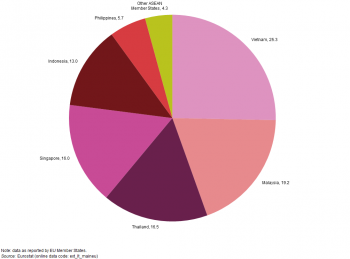
Figure 5: Origin of EU-28 imports of goods from ASEAN, 2015
(% share of EU-28 imports from ASEAN)
Source: Eurostat (ext_lt_maineu)
(% share of EU-28 imports from ASEAN)
Source: Eurostat (ext_lt_maineu)
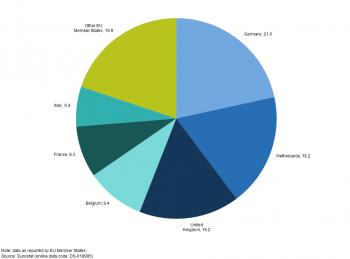
Figure 6: Destination of EU-28 imports of goods from ASEAN, 2015
(% share of EU-28 imports from ASEAN)
Source: Eurostat (DS-018995)
(% share of EU-28 imports from ASEAN)
Source: Eurostat (DS-018995)
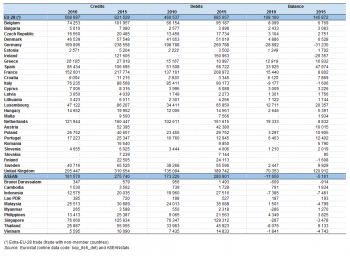
Table 5: International trade in services, 2010 and 2015
(million EUR)
Source: Eurostat (bop_its6_det) and ASEANstats
(million EUR)
Source: Eurostat (bop_its6_det) and ASEANstats
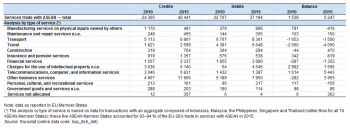
Table 6: International trade in services with ASEAN, EU-28, 2010 and 2015
(million EUR)
Source: Eurostat (bop_its6_det)
(million EUR)
Source: Eurostat (bop_its6_det)
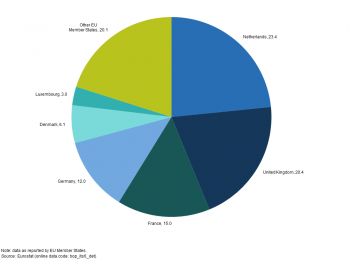
Figure 7: Origin of EU-28 exports of services to ASEAN, 2015
(% share of EU-28 exports to ASEAN)
Source: Eurostat (bop_its6_det)
(% share of EU-28 exports to ASEAN)
Source: Eurostat (bop_its6_det)
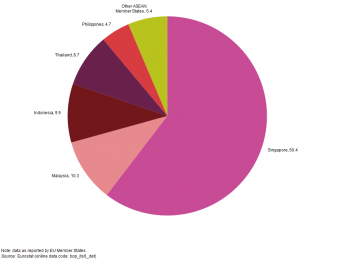
Figure 8: Destination of EU-28 exports of services to ASEAN, 2015
(% share of EU-28 exports to ASEAN)
Source: Eurostat (bop_its6_det)
(% share of EU-28 exports to ASEAN)
Source: Eurostat (bop_its6_det)
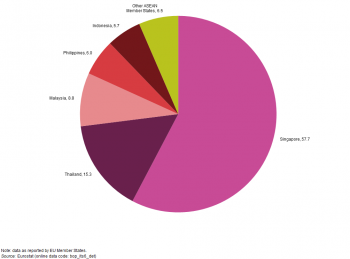
Figure 9: Origin of EU-28 imports of services from ASEAN, 2015
(% share of EU-28 imports from ASEAN)
Source: Eurostat (bop_its6_det)
(% share of EU-28 imports from ASEAN)
Source: Eurostat (bop_its6_det)
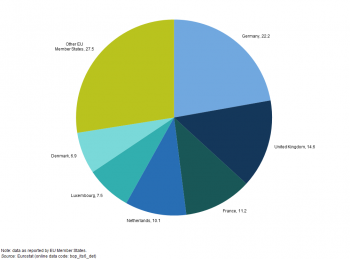
Figure 10: Destination of EU-28 imports of services from ASEAN, 2015
(% share of EU-28 imports from ASEAN)
Source: Eurostat (bop_its6_det)
(% share of EU-28 imports from ASEAN)
Source: Eurostat (bop_its6_det)
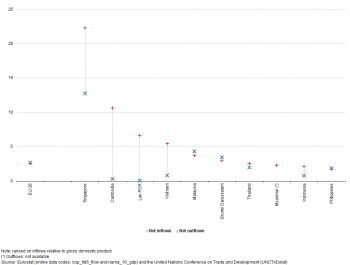
Figure 11: Foreign direct investment net inflows and net outflows, average 2013–2015
(% of gross domestic product)
Source: Eurostat (bop_fdi6_flow) and (nama_10_gdp) and the United Nations Conference on Trade and Development (UNCTADstat)
(% of gross domestic product)
Source: Eurostat (bop_fdi6_flow) and (nama_10_gdp) and the United Nations Conference on Trade and Development (UNCTADstat)
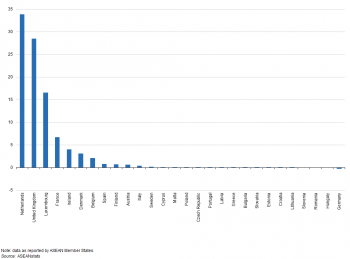
Figure 12: Origin of net outflows of foreign direct investment from EU-28 to ASEAN, average 2013–2015
(% share of net outflows of foreign direct investment from EU-28 to ASEAN)
Source: Eurostat (bop_fdi6_flow) and (nama_10_gdp)Source: ASEANstats
(% share of net outflows of foreign direct investment from EU-28 to ASEAN)
Source: Eurostat (bop_fdi6_flow) and (nama_10_gdp)Source: ASEANstats
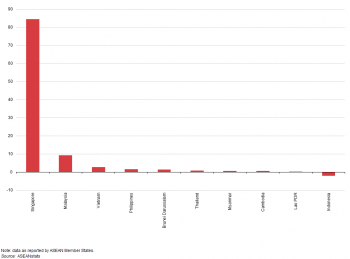
Figure 13: Destination of net outflows of foreign direct investment from EU-28 to ASEAN, average 2013–2015
(% share of net outflows of foreign direct investment from EU-28 to ASEAN)
Source: Eurostat (bop_fdi6_flow) and (nama_10_gdp)Source: ASEANstats
(% share of net outflows of foreign direct investment from EU-28 to ASEAN)
Source: Eurostat (bop_fdi6_flow) and (nama_10_gdp)Source: ASEANstats
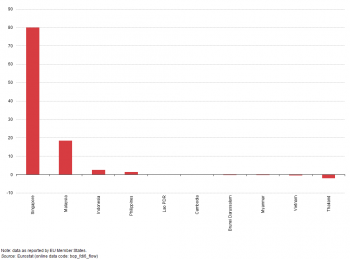
Figure 14: Origin of net inflows of foreign direct investment from ASEAN to EU-28, average 2013–2015
(% share of net inflows of foreign direct investment from ASEAN to EU-28)
Source: Eurostat (bop_fdi6_flow)
(% share of net inflows of foreign direct investment from ASEAN to EU-28)
Source: Eurostat (bop_fdi6_flow)
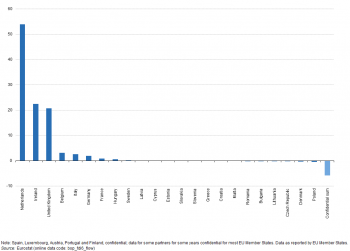
Figure 15: Destination of net inflows of foreign direct investment from ASEAN to EU-28, average 2013–2015
(% share of net inflows of foreign direct investment from ASEAN to EU-28)
Source: Eurostat (bop_fdi6_flow)
(% share of net inflows of foreign direct investment from ASEAN to EU-28)
Source: Eurostat (bop_fdi6_flow)
See also
- 40 years of EU-ASEAN Cooperation – key statistics — online publication
- Asia-Europe Meeting (ASEM) — a statistical portrait — online publication
- Asia-Europe Meeting (ASEM) and EU — key statistical indicators
- EU trade and investment statistics with the Association of South East Asian Nations (ASEAN)
- South Korea-EU — trade in goods
- The EU in the world
Further Eurostat information
Publications
- ASEM partners accounted for 44% of EU28 imports and 30% of exports in 2013 — News release October 2014
- EU-South Korea trade relations boosted by the recent free trade agreement — Statistics in focus 1/2015
- EU trade in goods with India in slight deficit in 2015 for a third consecutive year — News release March 2016
- From birth to death: a closer look at business demography in selected EU countries and the Republic of Korea — Statistics in focus 1/2014
- Goods trade with ASEAN countries rebounds from 2009 to 2010 — Statistics in focus 47/2011
- The EU in the world 2013 — A statistical portrait — Statistical book (2013)
- The European Union and the BRIC countries — Pocketbook (2012)
- The European Union and the Republic of Korea — A statistical portrait — Statistical book (2012)
Database
- Balance of payments, see:
- Balance of payments - International transactions (BPM6) (bop_6)
- European Union direct investments (BPM6) (bop_fdi6)
- EU direct investment flows, breakdown by partner country and economic activity (BPM6) (bop_fdi6_flow)
- European Union direct investments (BPM6) (bop_fdi6)
- International trade in goods (ext_go)
- International trade in goods – aggregated data (ext_go_agg)
- International trade in goods – detailed data (detail)
- International trade in services, geographical breakdown (BPM6) (bop_its6)
- International trade in services (since 2010) (BPM6) (bop_its6_det)
Dedicated section
- Balance of payments
- International Statistical Cooperation
- International trade in goods
- International trade in services
Source data for tables (MS Excel)
External links
- European Commission – DG International Development and Cooperation — EuropeAid: Building strong and lasting links with Asia
- European Commission — EU-ASEAN Brochure
- European Commission — EU-ASEAN Trade & Investment booklet
[[Category:<Asia>|EU-ASEAN cooperation - key trade and investment statistics]] [[Category:<Balance of payments>|EU-ASEAN cooperation - key trade and investment statistics]] [[Category:<Non-EU_countries>|EU-ASEAN cooperation - key trade and investment statistics]] [[Category:<Statistical article>|EU-ASEAN cooperation - key trade and investment statistics]] [[Category:<Trade in goods>|EU-ASEAN cooperation - key trade and investment statistics]] [[Category:<Trade in goods by area>|EU-ASEAN cooperation - key trade and investment statistics]] [[Category:<Trade in services>|EU-ASEAN cooperation - key trade and investment statistics]]