Archive:Sectoral productivity at regional level
- Data from March 2008, most recent data: Further Eurostat information, Main tables and Database.
This article looks at the differences between the regions of the European Union with regard to the productivity of the most important sectors.
The relation of sectoral gross value added to employment is first analyzed at national level. This leads to the selection of two sectors — real estate, renting and business activities, and manufacturing — which are the most important for the EU’s productivity and employment. Regional data are then analyzed to capture the levels of productivity in these sectors at regional level. The last section of the article takes a look at how the sectors have evolved in the last five years in terms of GVA and employment, again at regional level.
Main statistical findings
The top sectors
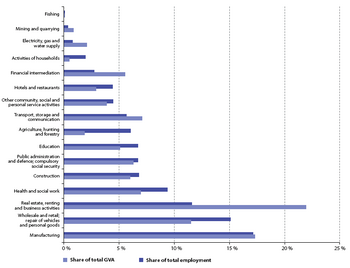
In 2005, the business sector that generated the highest GVA was real estate, renting and business activities (NACE section K). This sector contributed more than one-fifth of the total GVA created in the EU and it had a share of 12 % of total employment, making it the third highest employer in the EU. As a result, this sector had extremely high GVA per employed person, more than double the average across all sectors (See Graph 1).
In terms of employment, the top sector in 2005 was manufacturing (NACE section D). This sector accounted for 17 % of total EU employment, or 37 million jobs. Manufacturing contributes approximately the same share to total GVA (17 %) as to total employment. Hence, its GVA per person employed is close to the average for all sectors.
The second most important sector in terms of employment — wholesale and retail trade — covers 15 % of employment. This sector’s share of GVA, at 11 %, is considerably lower than its share in employment, leading to GVA per person employed of 75 % of the average for all sectors.
Thus, the two business sectors of real estate, renting and business activities and manufacturing are currently the most important sectors for the growth of the EU economy and its level of employment, respectively. This, and the changes that they have experienced in recent years, makes them the perfect candidates to show how sectoral productivity develops in the European Union, Norway, Switzerland and Croatia.
The real estate, renting and business activities sector (NACE section K) is a rather diverse sector and includes five distinct sub-sectors (NACE divisions 70 to 74):
- 70 - Real estate activities;
- 71 - Renting of machinery and equipment;
- 72 - Computer and related activities;
- 73 - Research and development;
- 74 - Other business activities (such as accounting, market research, management consultancy, architecture, advertising and technical testing).
There are no GVA data available for these five sub-sectors, but the Labour force survey can be used to estimate their share of employment. Other business activities (Division 74) is the most important, accounting for approximately 70 % of employment in this sector.
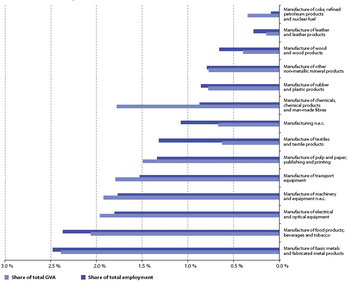
The manufacturing sector consists of 14 subsectors (see Graph 3).
Productivity at regional level
While GVA and employment data at national and EU level are available for more detailed industry categories, the data available at regional level limit detailed analysis to six sectors.
Real estate, renting and business activities are part of the wider financial intermediation and business sector (NACE sections J and K), together with the financial intermediation sector (J). In 2005, real estate, renting and business activities accounted for more than 80 % of total employment and nearly the same share of total GVA of the EU’s financial intermediation and business sector.
The manufacturing sector had an even higher share of total GVA and total employment in its group, total industry (NACE sections C, D and E), at 87 % and 95 %, respectively.
Therefore, analyzing the productivity of the financial intermediation and business sector and that of total industry can still give us a useful insight into the productivity levels and growth in the real estate, renting and business activities and manufacturing sectors at regional level.
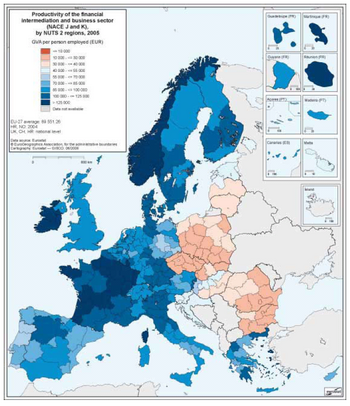
Map 1 shows the regional variation in the productivity of the financial intermediation and business sector. The visible patterns are at national level, with clear distinctions between the 15 'older' and the 12 'newer' EU Member States.
The productivity of the financial intermediation and business sector is above the EU average in 120 out of 179 regions [1] in the EU-15. The regions with the highest productivity are concentrated in Ireland, Luxembourg and France. The average productivity of the regions in these three countries is 45 % higher than the EU average. Of the non-EU members displayed on the map, Norway has the most productive financial intermediation and business sector, with productivity 80 % above the EU average.
In the EU-15, the 15 regions with the lowest productivity in financial intermediation and business are in north-eastern Germany (Leipzig, Sachsen-Anhalt, Dresden, Berlin, Thüringen and Mecklenburg-Vorpommern), the whole of Portugal, and Campania in southern Italy, followed by Comunidad de Madrid in Spain and Attiki in Greece. The latter have a level of GVA in the financial intermediation and business sector comparable with other capital regions, but the number of people working in the sector is much higher, which explains the low productivity.
In contrast, the productivity in all of the 56 regions in the new Member States that joined in 2004 and 2007 is below the EU average, the sector’s average productivity being only 35 % of the EU average. As can be seen in Map 1, the highest productivity is in Cyprus and Malta, followed by Slovenia, Estonia and the seven Hungarian regions.
The regions with the lowest productivity are all in Bulgaria, in the north of the Czech Republic, followed by the south and centre of the country, except for the region of Prague, and the eastern regions of Romania.
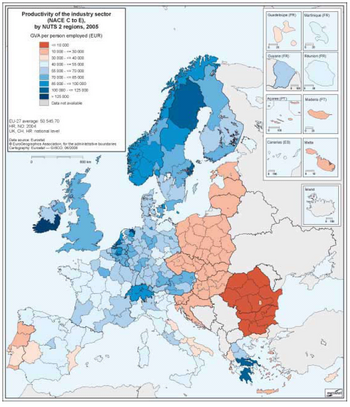
Map 2 depicts the productivity of all industry sectors and shows the same division between the older and the newer Member States, a clear distinction between the 10 Member States that joined in 2004 and Romania and Bulgaria, and more regional variation in the EU-15.
The number of regions with above-average productivity is 122, all in the EU-15. Groningen in the north of the Netherlands ranks the highest. The most productive regions include a further two Dutch regions, Zeeland and Zuid-Holland, and Southern and Eastern in Ireland, Brabant Wallon, Antwerpen and the capital region in Belgium, Sterea Ellada in Greece, the Övre Norrland in the north of Sweden, the regions of Stockholm and Hamburg.
Standing at half the EU's average productivity, Portuguese industry has the lowest productivity among the pre-2004 Member States, followed by the Iperios region in the north of Greece, the Greek islands, the Spanish Extremadura and Comunidad Valenciana, and the regions of southern Italy.
The total level of productivity in industry is three times lower in the 12 new Member States than in the EU-15. Cyprus is the region with the highest productivity among the new Member States. The other regions with relatively high productivity in all industry sectors are the Slovak, Czech and Hungarian capital regions, the whole of Slovenia and Malta, followed by other Czech, Hungarian and Polish regions.
As shown in Map 2, Bulgaria and Romania have the lowest values for productivity in the sector.
The importance of the two sectors described is clearly not the same for the older and the newer Member States. Despite low productivity levels in the new Member States, the importance of the industry sector is higher than in the EU-15 (see Table 1).
While the industry sector in the new Member States employs nearly a quarter of all employed people, it also accounts for a quarter of the countries’ total GVA. In the EU-15, industry represents less than one-fifth of total GVA and only 17 % of total employment.
The situation in the financial intermediation and business sector is the reverse. The sector’s share of total GVA is only 18 % in the 12 new Member States, but more than a quarter in the EU-15. Finally, the number of people working in the sector in the EU-15 is twice as high as in the new Member States.
How has sectoral productivity developed in recent years?
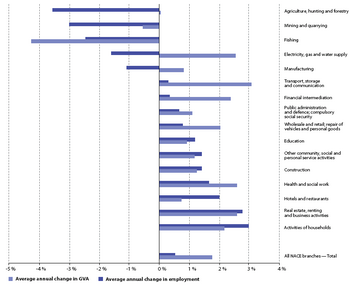
As shown in Graph 2, the real estate, renting and business activities sector has generated one of the highest employment growths in the EU as a whole. The sector grew by nearly 3 % a year between 2000 and 2005. This has led to an increase in employment of 3.5 million jobs in this sector. In addition, GVA growth between 2000 and 2005 was also very strong, at 2.7 % a year. In short, this sector has generated very high employment and GVA growth in recent years and is clearly one of the EU’s growth sectors.
The manufacturing sector, however, saw its total employment shrink between 2000 and 2005, at an average of –1.1 % a year or a loss of 2.3 million jobs. Manufacturing GVA grew by 0.8 % a year between 2000 and 2005, less than half of total GVA growth of 1.8 %.
Financial intermediation also had very high growth in GVA. The sector with the biggest increase in GVA, however, is transport, storage and communication, with an average annual increase of 3.1 %. However, employment in transport, storage and communication grew very little.
Productivity grows when GVA increases...
To illustrate the growth in the regions of these sectors between 2000 and 2005, this section looks once more at the six-sector breakdown.
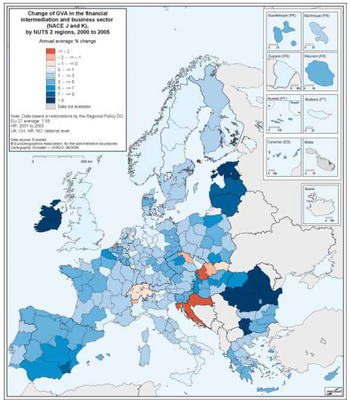
Map 3 shows the regional growth of GVA in the financial intermediation and business sector between 2000 and 2005. GVA growth in this sector was almost universally positive, with only a few exceptions. These were all the regions in Slovakia, with the exception of the capital region, Severovýchod in the north-eastern part of the Czech Republic and a few regions in the Netherlands and Germany. Switzerland and Croatia also experienced a contraction of GVA in this sector.
Moreover, 158 of the 236 EU regions displayed on the map had growth rates above the average for the sector, including the vast majority of the regions in the newer Member States, with some Romanian regions growing at a rate of more than 10 % a year. Thus, despite low productivity levels in 2005, as shown above, GVA grew fast in the 12 new Member States, reaching an average rate of 3.8 %, double the average for the Member States of the EU-15.
In contrast to the financial intermediation and business sector, the growth rate of GVA in total industry was less than half the total GVA growth rate at EU level. At regional level, however, growth in industry GVA trailed total GVA growth only in 50 out of 236 regions. This was the case for Italy, Denmark and the UK; the other lagging regions concentrated in Portugal, Belgium and the Netherlands (See Map 4).
In the newer Member States, the growth of GVA in total industry, at 4 % a year against 0.7 % in the EU-15, is further evidence of its importance, as mentioned previously.
...or when employment decreases
Map 5 shows a similar picture for the growth of employment in the financial intermediation and business sector to the growth of GVA.
The sector experienced very high employment growth between 2000 and 2005 equivalent to five times the growth rate for all sectors. The regional distribution of this employment growth is generally even, with high growth everywhere except in the Netherlands, France and a few regions in the new Member States.
The highest growth rates were recorded in Greece, the two most recent members, Romania and Bulgaria, and Spain.
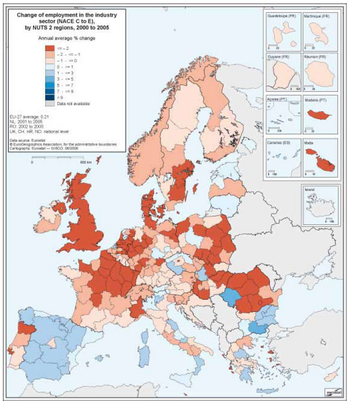
Map 6 describes the change of employment in industry and leaves no doubt that the sector is on the way to losing its position as the EU’s top employer. The decline in number of people employed in industry is in evidence in almost all the regions, with the exception of a few regions in Italy, the new Member States and Spain, which experienced strong growth.
Manufacturing vs knowledge economy
While real estate, renting and business activities (the same applies to financial intermediation) are defined by Eurostat as knowledge-intensive services, thus making them part of the definition of knowledge economy as a whole, this is not the case for manufacturing.
Only four of the 14 sub-sectors of manufacturing in Graph 3 — manufacture of electrical and optical equipment (NACE sub-section DL),manufacture of machinery and equipment not elsewhere classified (n.e.c.) (DK), manufacture of transport equipment (DEM) and manufacture of chemicals, chemical products and man-made fibres (DG) — use high or medium-high technology and so are considered to be part of the knowledge economy.
These four sub-sectors displayed the highest productivity in the EU in 2005. In general, high and medium-tech manufacturing employment declined a little, but the downswing in the other manufacturing sectors was much stronger. GVA growth in the high and medium-high technology manufacturing sectors was far higher than in the low and medium-low technology sectors.
The same applies to knowledge-intensive services in comparison with less knowledge-intensive services, such as the hotel and restaurants sector, public administration and defence, activities of households, and so on.
The knowledge economy covers almost 40 % of total employment within the EU, and this share is growing. It includes sectors which are most likely to create growth as they tend to be less labour-intensive, have higher valued added per person employed, are less exposed to globalization, use highly skilled labour and thus have the capacity to innovate and create, and turn new ideas into value. Indeed, innovation, skills, enterprise and competition are the main drivers of increases in long-term productivity.
In 2005, the most important manufacturing subsectors in terms of employment were:
- manufacture of basic metals and fabricated metal products (DJ);
- manufacture of food products, beverages and tobacco (DA);
- manufacture of electrical and optical equipment (DL);
- manufacture of machinery and equipment n.e.c. (DK);
- manufacture of transport equipment (DEM).
Both manufacture of basic metals and fabricated metal products (DJ) and manufacture of food products, beverages and tobacco (DA) have relatively lower technological intensity.
These five sub-sectors each account for between 1.5 % and 2.5 % of total employment in the sector. Only one of these five important manufacturing sub-sectors, manufacturing of transport equipment, increased its share of employment. The only other sub-sector to experience an increase in employment is manufacturing of rubber and plastic products, which is classified as using mostly low technology.
The share of GVA in the 14 sub-sectors follows a similar path. The sub-sectors with the highest share are:
- manufacture of basic metals and fabricated metal products (DJ);
- manufacture of food products, beverages and tobacco (DA),
These are followed by the four high and medium-technology sub-sectors:
- manufacture of electrical and optical equipment (DL);
- manufacture of machinery and equipment n.e.c. (DK);
- manufacture of transport equipment (DEM);
- manufacture of chemicals, chemical products and man-made fibres (DG).
Between 2000 and 2005, only two sub-sectors saw their GVA decline:
- manufacture of leather and leather products;
- manufacture of textiles and textile products.
Both these sectors are classified as low technology.
These two sub-sectors also lost the highest share of employment and are included in the analysis of the European Commission's Regional Policy DG as sectors vulnerable to increased global competition.
Two sub-sectors experienced very high increases in GVA:
- manufacture of electrical and optical equipment;
- manufacture of chemicals, chemical products and man-made fibres.
Two more subsectors experienced above-average increases in GVA:
- manufacturing of rubber and plastic products;
- manufacturing of transport equipment.
Data sources and availability
A common definition of productivity is ‘a ratio of a volume measure of output to a volume measure of input use’ (OECD, 2001). A volume measure of regional (and sectoral) GVA is the preferred measure for output. GVA is preferable to GDP at the regional level because it excludes taxes or subsidies on products that are difficult to attribute to local units. To measure productivity at regional and sectoral levels, GVA is divided by the number of people employed, which is also referred to as labour productivity. Labour productivity provides a better indicator than GVA per inhabitant because it is not distorted by potential regional demographic differences, including different dependency ratios. Nor is it distorted by cross-regional commuting that causes disparities between the number of people who live in a region and the number who work there.
However, GVA per person employed does not take account of the balance between different sectors in a region. Nor does it take regional labour market structures or different working patterns into consideration, such as the possible mix of part- and full-time workers, home workers, and so on. Therefore, GVA per hour worked is a more appropriate measure of productivity, because it apportions GVA to the total hours worked by the workforce.
Currently regional figures for total number of hours worked are still estimates. In future, systematic collection of regional data for hours worked will become available. Data availability will improve substantially from 2008 onwards.
Another issue is the availability of regional deflators for GVA. Regional GVA is not available at constant prices. As a result, growth rates cannot be calculated. In this chapter, sector-specific regional GVA at current prices has been used to regionalize sector-specific national-level GVA at constant prices.
As regards the sectoral breakdown of regional GVA and employment data, as of this year, regional accounts only provide a six-sector breakdown for NUTS 2 regions.
The six sectors are:
- Sections A + B: agriculture, forestry and fishery;
- Sections C–E: mining, manufacturing, electricity, gas and water supply;
- Section F: construction;
- Sections G–I: wholesale and retail trade, repair of vehicles and personal goods, transport, storage and communication;
- Sections J + K: financial intermediation, real estate, renting and business activities;
- Sections L–P: public administration and defence, compulsory social security, education, health and social work, other community, social and personal service activities, activities of households.
The availability of regional accounts data at NUTS 2 level is not complete: for Malta, no GVA and, for the UK, no regional GVA and employment figures are available.
Context
The analysis shows that the decades-old trend of a shift from the primary and secondary sectors to the service sector, from less productive to more productive sectors, and from the less knowledge-intensive economy to the knowledge economy continues.
We can distinguish between two types of regions in the EU: regions with a low share in the high value-added sectors (but very high growth rates) and persistently high shares in the less value-added and less knowledge-intensive sectors, and regions with a high share (but lower growth rates) in the high value-added and more knowledge-intensive sectors, such as real estate, renting and business activities and the high and medium-tech manufacturing sector.
The majority of the regions in the first group fall under the convergence objective of the European cohesion policy [2]. Similarly, most of the regions in the second group fall under the regional competitiveness and employment objective (RCE) of European cohesion policy. This suggests that, in the RCE regions, the high value-added and knowledge-intensive sectors have been the main drivers of growth, and economic restructuring towards these sectors can also play a crucial role in helping the convergence regions to catch up. This has several implications from a policy point of view.
The main challenges in the convergence regions, located mainly in the new Member States, are the huge employment loss in the primary sectors and the emerging competition from the Asian economies in the low value-added sectors.
The first challenge calls for measures to ensure that the labour force flows from declining to expanding activities. Skill requirements for the newly created jobs in the service sector, however, tend to be higher than those for the jobs lost in manufacturing. Hence, convergence regions should focus on improving the level of education of their labour forces and increasing their share of knowledge workers. In the meantime, the issue of lifelong learning presents itself as a genuine means of reducing periods of unemployment.
Secondly, these regions will need to modernize and diversify their economic structure into high value-added sectors. Industry is bound to remain an important sector for convergence regions, at least in the medium term. Therefore, it is important to reorientate production towards highly productive and value-added activities by creating the conditions for business, and particularly SMEs, to adopt and adapt innovative products and processes, to establish co-operation networks with other enterprises and with research institutes, to access risk capital and to internationalize their activities. Currently, around 80 % of all resources under European cohesion policy are available to convergence regions, with a substantial amount going to economic restructuring.
In the RCE regions, the challenge lies in maintaining and possibly increasing the competitiveness of these regions in the high value-added sectors, not only in Europe but also in relation to regions of the United States in particular. Investment in research and development has a key role to play in deciding who has a competitive edge. Investment in R & D in the RCE regions is almost three times higher than in the convergence regions but lower than in comparable US regions.
This clearly underlines the focus of European cohesion policy in RCE regions towards more innovation, as underscored in particular by its contribution to achieving the aims of the renewed Lisbon Strategy.
In this respect, European cohesion policy requires older Member States to earmark at least 75 % of the funds for their RCE regions and 60 % of the funds for the convergence regions in investment categories that are particularly conducive to growth, ‘such as R&D, physical infrastructure, environmentally friendly technologies, human capital and knowledge’. Earmarking was not compulsory for the newer Member States, but they also focus a substantial amount of their investment on these types of investments.
Most of the Member States have engaged in the exercise and the earmarking targets have been reached. An amount of around EUR 210 billion has been earmarked in support of these investments, an increase of over EUR 55 billion compared with the programming period 2000–06.
Further Eurostat information
Publications
- Living conditions in Europe - Statistical pocketbook - Data 2002-2005
- The social situation in the European Union 2005-2006
Main tables
- Regions and cities, see:
- Regional statistics
- Data
- Main tables
- Regional labour market statistics (t_reg_lmk)
- Main tables
- Data
Database
- Regions and cities, see:
- Regional statistics
- Data
- Database
- Regional labour market statistics
- Database
- Data
Other information
- Council Decision of 7 July 2008 on guidelines for the employment policies of the Member States (legal text)
- Labour Force Survey in the EU, Candidate and EFTA countries - Main characteristics of the 2006 national surveys
External links
- European Commission - Lisbon Strategy for Growth and Jobs
- European Commission - Regional Policy - Cohesion Policy 2007-2013
See also
- Employment statistics
- GDP at regional level
- Regional labour markets
- Regional specialization and business concentration
Notes
- ↑ The UK is analyzed at national level, due to lack of regional data. Normally, the total number of regions in the EU-15 would be 216, which makes 271 (NUTS 2) regions for the whole of the EU-27
- ↑ Convergence regions are the NUTS 2 regions whose GDP per inhabitant, measured in purchasing power parities for the period 2000–02, is less than 75 % of the average GDP of the EU-25 for the same period. All the nonconvergence regions are eligible under the regional competitiveness and employment objective.
