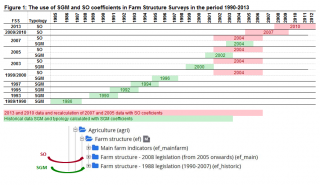
File:Figure 1.The use of SO and SGM coefficients in Farm Structure Surveys in the period 1990-2013.png

Size of this preview: 800 × 463 pixels. Other resolutions: 320 × 185 pixels | 889 × 514 pixels.
Original file (889 × 514 pixels, file size: 101 KB, MIME type: image/png)
File usage
There are no pages that use this file.