Territorial typologies
Traditionally, typologies of territory were determined by population size and density of local administrative units at level 2 (LAU level 2), such as communes, municipalities or local authorities. The typologies that are described here use a population grid, which goes far beyond the administrative territorial units. The population grid enables comparable results, is stable over the time and is not a result of historical circumstances which the administrative boundaries often are. This article provides a short overview of the typologies, including definitions, terminology and some basic statistical data.
These typologies start by classifying grid cells of 1 km² to a typology of clusters according to their similarities in terms of population size and density: each grid cell is classified to one type of cluster only. Areas (LAU level 2) or regions (NUTS level 3) can then be classified to area or regional typologies based on the population share in different types of clusters: again, each LAU level 2 area or NUTS level 3 region is classified to one type only. In each of these various typologies (of clusters, areas or regions) the whole geographical territory of the European Union (EU) is covered without any overlaps or omission.
The area typology applied to LAU level 2 is primarily used in surveys such as the labour force survey (LFS) and the survey on income and living conditions (SILC); the regional typologies applied to the NUTS level 3 regions are mainly used to monitor rural and urban development, maritime economy and and development in metropolitan regions. However, the metropolitan and the coastal typologies are out of the scope of this article.
Full article
Typologies
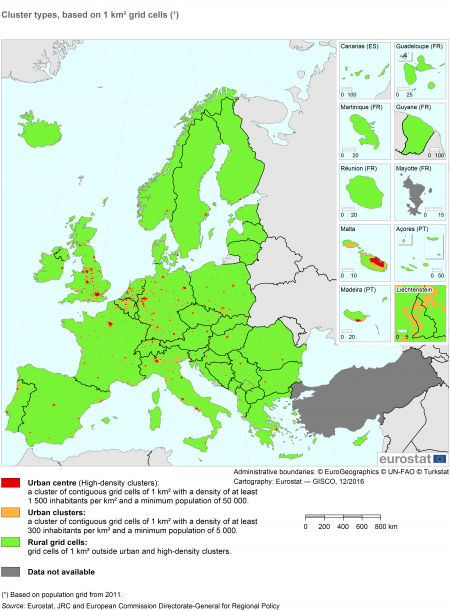
Cluster types
The typology of clusters classifies 1 km² grid cells (and clusters thereof), splitting them into three types. The criteria used are the population density in the individual grid cells and the combined population level of clusters, where clusters are made up of contiguous cells (in other words, neighbouring or adjoining cells); see later for a more detailed explanation of contiguous cells and the so-called gap-filling technique used for high-density clusters. The three types of grid cells or clusters in the typology are the following.
- Urban centres (High-density clusters): clusters of contiguous grid cells of 1 km² with a density of at least 1 500 inhabitants per km² and a minimum population of 50 000 after gap-filling.
- Urban clusters: clusters of contiguous grid cells of 1 km²with a density of at least 300 inhabitants per km² and a minimum population of 5 000.
- Rural grid cells: grid cells outside high-density clusters and urban clusters.
Contiguous cells and filling gaps in the cluster typology
To determine population size, the grid cells need to be grouped in clusters. The methods presented here use three different rules for contiguity to create clusters. These three rules are explained below.
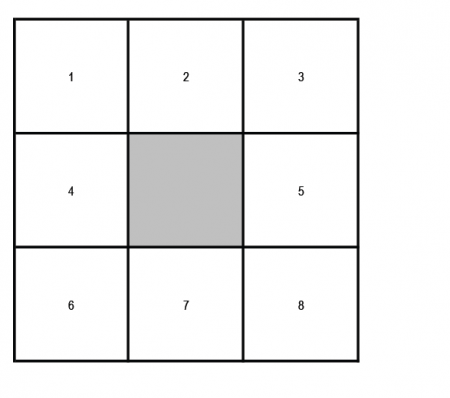
- Contiguous including diagonals — used for urban clusters If the central square (grid cell) in Figure 1 is above the density threshold, it will be grouped with each of the other surrounding eight grid cells that exceed the density threshold.
- Contiguous excluding diagonals — used for high-density clusters If the central square in Figure 1 is above the density threshold, it will be grouped with each of the four cells directly above, below or next to the central square that also exceed the density threshold. This means that cells numbered 2, 4, 5 and 7 can be included in the same cluster. Cells with number 1, 3, 6 and 8 cannot as they have a diagonal connection.
- The majority rule or gap-filling — used for high-density clusters
The goal for the high-density clusters is to identify urban centres without any gaps. Therefore, enclaves need to be filled. If the central square in Figure 1 is not, in its own right, a part of a high-density cluster, it will be added to a high-density cluster if five or more of the eight surrounding cells (therefore including diagonals) belong to a single high-density cluster. This rule is applied iteratively until no more cells can be added.
Degree of urbanisation typology for LAU level 2 areas — an area typology
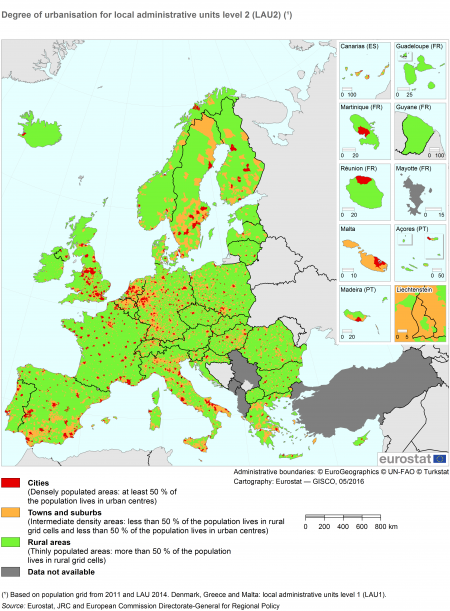
Depending on the share of the population living in the different types of cluster, LAU level 2 areas are classified into three degrees of urbanisation. Due to some national specificities, the degree of urbanisation classifications of Denmark, Greece and Malta have also been produced at the LAU level.
- Cities (Densely populated areas): at least 50 % of the population lives in high-density clusters [1].
- Towns and suburbs (intermediate density areas): less than 50 % of the population lives in rural grid cells and less than 50 % lives in high-density clusters.
- Thinly-populated areas/rural areas: more than 50 % of the population lives in rural grid cells.
Urban-rural typology for NUTS level 3 regions — a regional typology
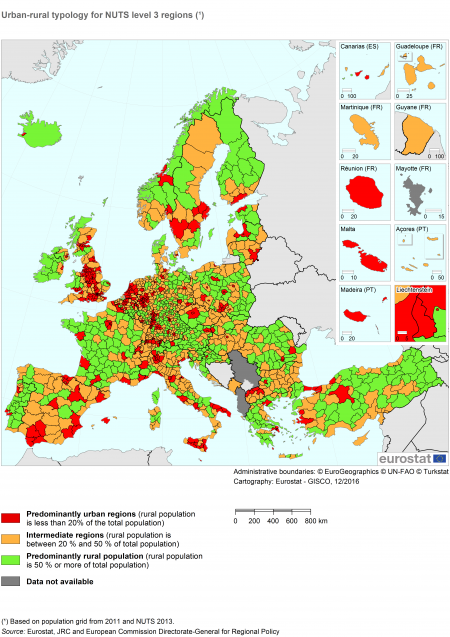
Depending on the share of the rural population (in other words, the share of the population living in rural grid cells, the NUTS level 3 regions are classified into the following three groups:
- Predominantly urban regions/urban regions: the rural population is less than 20 % of the total population.
- Intermediate regions: the rural population is between 20 % and 50 % of the total population.
- Predominantly rural regions/rural regions: the rural population is 50 % or more of the total population.
To resolve the distortion created by extremely small NUTS 3 regions, for classification purposes regions smaller than 500 km² are combined with one or more of their neighbours.
In a last step, the size of the cities in the region is considered.
- A region classified as predominantly rural by the criteria above becomes intermediate if it contains a city of more than 200 000 inhabitants representing at least 25 % of the regional population.
- A region classified as intermediate by the criteria above becomes predominantly urban if it contains a city of more than 500 000 inhabitants representing at least 25 % of the regional population.
Summary table: names and alternative names
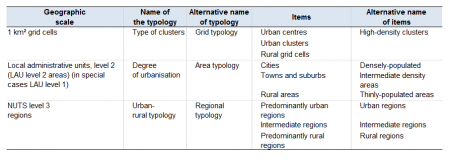
The names of typologies and items may differ according to context, users or means of dissemination. Table 1 gives a summary of the vocabulary used as well as the geographical scale.
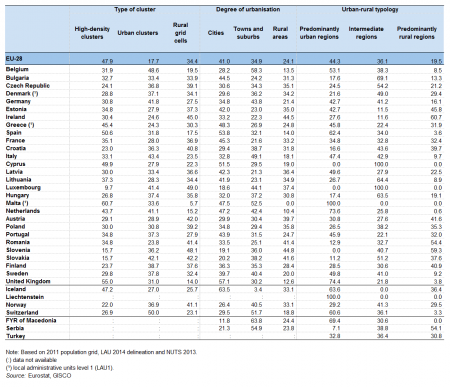
Although these typologies classify the same phenomena, the use of different geographical scales result in different shares of the rural population. Thus, as Table 2 shows, around 34 % of the EU-28 population lived in rural grid cells, 24 % in rural areas and 19.5 % in predominantly rural regions. Since a high density cell is also an urban cell, the overlapping populations have been excluded from the urban cell's populations.
Moreover, the variability between the figures is more pronounced at the national level than for the EU as a whole. As Table 2 illustrates, 32.7 % of the Bulgarian population lived in high-density clusters, 44.5 % in cities and 17.6 % in predominantly urban regions. Another example for the different sensitivity of the three typologies is Luxembourg (a special case where the only NUTS 3 region is equal to the country level) where 9.7 % of the population lived in high-density clusters, 18.7 % in the city and no one lived in predominantly urban regions since the only Luxembourgish region has been classified as intermediate. The most densely populated EU country was Malta with just 5.7 % of its population living in rural grid cells.
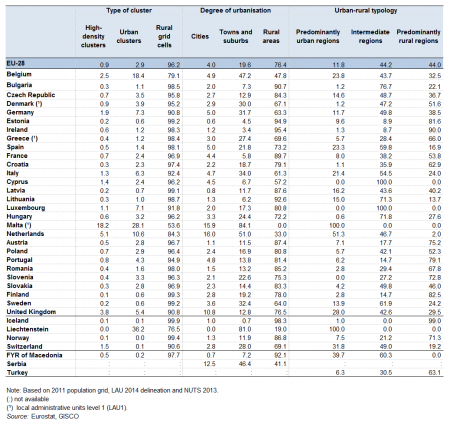
The data produced using these different typologies present a broader range in terms of surface area than in terms of the population. As Table 3 shows, 23.6 % of the EU-28’s land area was covered by urban areas (cities, towns and suburbs) and around 44 % was covered by intermediate and predominantly rural regions (each category). Again, there is greater variability at the national level than for the EU as a whole, as Table 3 clearly shows. The most significant variations are observed in Spain, Cyprus and Luxembourg.
Source data for tables and graphs
Data sources
These typologies classify different territories, defined at different geographical scales, namely grid cells, LAU 2 areas or NUTS level 3 regions. However, the analysis of the statistical data using these typologies may be disseminated at a higher geographical level. Hence, the proportion of EU-28 land area classified as being composed of intermediate regions is an indicator for the EU based on a regional typology. A similar indicator could also be disseminated at national ant at NUTS level. However, in some cases statistical data using these typologies can only be calculated and disseminated for the EU as a whole or at the national level. This is mainly to do with representativeness, confidentiality and reliability of the indicator. Some surveys, for example the LFS and EU-SILC, can provide reliable statistics by degree of urbanisation for thinly populated areas as well as for cities, towns and suburbs and by urban-rural typology at the national level, but not at NUTS level 3. Thus the territorial typologies can add great value to the diversity of the data disseminated by Eurostat.
Context
The European Commission has introduced typologies based on population size and density to monitor situations and trends in urban and rural areas and regions. The Treaty on European Union (also called the Treaty of Maastricht) specifically mentions that particular attention should be paid to rural areas and rural regions. Harmonised European definitions of territorial typologies are therefore essential.
On the other hand, the cities, towns and suburbs together called urban areas are used to design, monitor and assess cohesion policy and its urban dimension. The ‘Pact of Amsterdam’ '[http://ec.europa.eu/regional_policy/sources/policy/themes/urban-development/agenda/pact-of-amsterdam.pdf. adopted in May 2016 establishes the Urban Agenda for the EU and lays out its key principles. It is expected that economic growth in the EU will come primarily from its towns and cities. Furthermore, the United Nations adopted a set of global goals to be achieved by 2030. Goal number 11 is to make cities inclusive, safe, resilient and sustainable.
The report '[http://ec.europa.eu/regional_policy/sources/docoffic/official/reports/cohesion6/light_6cr_en.pdf. Investment for jobs and growth — Sixth report on economic, social and territorial cohesion]’ aims to promote development and good governance in EU regions and cities. One of the main issues related to territorial cohesion is the need for data on different territorial levels, particularly for lower geographical levels. The classification of the degree of urbanisation provides a unique insight into trends at the local level, and highlights the differences between urban and rural areas. With this respect, harmonised European definitions of territorial typologies are essential.
Direct access to
- A system of urban-rural typologies - overview poster published by DG Regional policy
- A file with all the classifications can be found here.
- Please note that this link may not work with certain versions of Internet Explorer - please try another web browser (e.g. Chrome, Opera or Firefox) if you encounter problems.
- OECD regional typology (pdf file, 1.93 Mb)
Notes
- ↑ In addition, each high-density cluster of at least 50 000 inhabitants should have at least 75 % of its population in densely-populated LAU level 2 areas. This also ensures that all high-density clusters are represented by at least one densely-populated LAU level 2, even when this high-density cluster represents less than 50 % of the population of that LAU level 2.
