,_EU-28,_1960%E2%80%932015_(%C2%B9)_(per_1_000_persons)_YB16-fr.png)
, EU-28, 1960–2015 (¹) (per 1 000 persons) YB16-fr.png&body=Statistics Explained - Population change by component (annual crude rates), EU-28, 1960–2015 (¹) (per 1 000 persons) YB16-fr.png %0A https%3A%2F%2Fec.europa.eu%2Feurostat%2Fstatistics-explained%2Findex.php%3Ftitle%3DFile%3APopulation_change_by_component_%28annual_crude_rates%29%2C_EU-28%2C_1960%25E2%2580%25932015_%28%25C2%25B9%29_%28per_1_000_persons%29_YB16-fr.png)
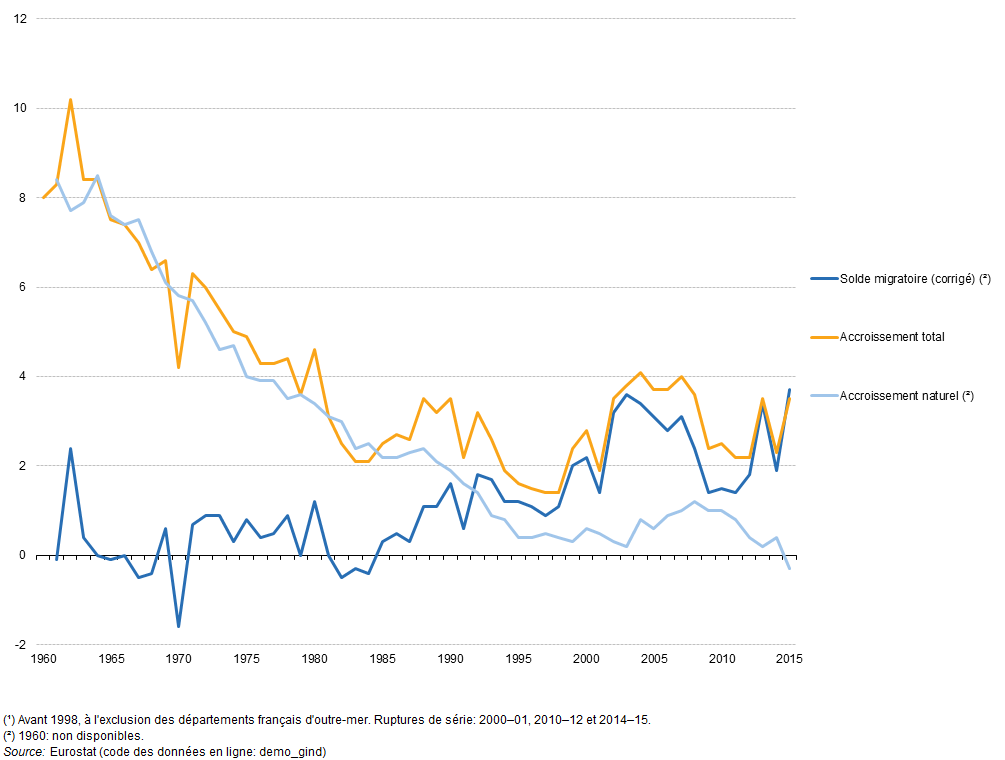
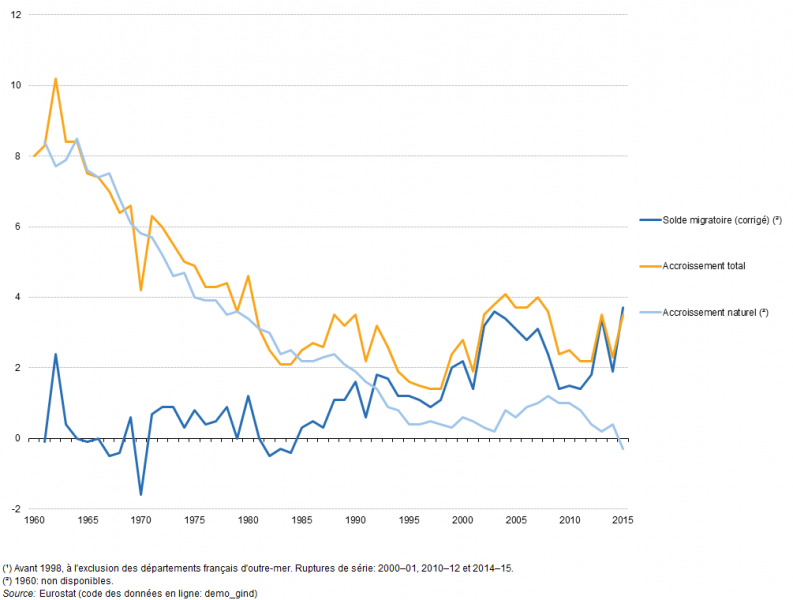
File:Population change by component (annual crude rates), EU-28, 1960–2015 (¹) (per 1 000 persons) YB16-fr.png
Revision as of 18:35, 19 December 2016 by EXT-S-Allen (talk | contribs)
Size of this preview: 793 × 600 pixels. Other resolutions: 318 × 240 pixels | 1,005 × 760 pixels.
Original file (1,005 × 760 pixels, file size: 44 KB, MIME type: image/png)
File usage
The following file is a duplicate of this file (more details):
,_EU-28,_1960%E2%80%932015_(%C2%B9)_(per_1_000_persons)_YB16-fr.png)
,_UE-28,_1960%E2%80%932015_(%C2%B9)_(pour_mille_habitants)_YB16-fr.png)
There are no pages that use this file.
,_EU-28,_1960–2015_(¹)_(per_1_000_persons)_YB16-fr.png&oldid=320218)
,_EU-28,_1960%E2%80%932015_(%C2%B9)_(per_1_000_persons)_YB16-fr.png)
,_EU-28,_1960%E2%80%932015_(%C2%B9)_(per_1_000_persons)_YB16-fr.png&action=edit&redlink=1)
,_EU-28,_1960%E2%80%932015_(%C2%B9)_(per_1_000_persons)_YB16-fr.png&action=history)