.PNG)
.PNG&body=Statistics Explained - Production indices for construction, seasonally adjusted, EU-27 (%).PNG %0A https%3A%2F%2Fec.europa.eu%2Feurostat%2Fstatistics-explained%2Findex.php%3Ftitle%3DFile%3AProduction_indices_for_construction%2C_seasonally_adjusted%2C_EU-27_%28%2525%29.PNG)
File:Production indices for construction, seasonally adjusted, EU-27 (%).PNG
Revision as of 15:29, 30 July 2010 by Verdodo (talk | contribs) (uploaded a new version of "File:Production indices for construction, seasonally adjusted, EU-27 (%).PNG")
.PNG)
.PNG&diff=prev&oldid=30797)
.PNG&direction=prev&oldid=30797)
No higher resolution available.
Production_indices_for_construction,_seasonally_adjusted,_EU-27_(%).PNG (757 × 334 pixels, file size: 19 KB, MIME type: image/png)
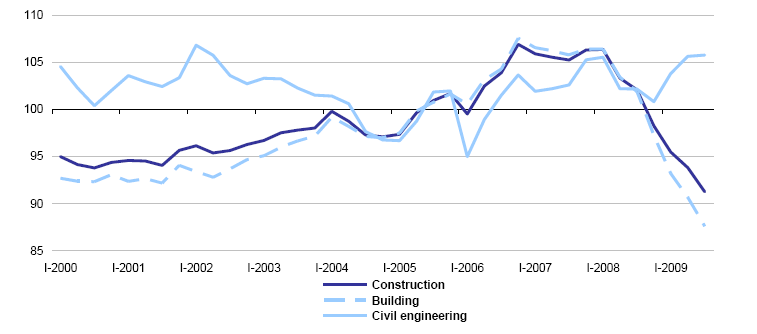
Production indices for construction, seasonally adjusted, EU-27 (%)
Graph created with data from December 2009
Most recent data available now, see:
Construction production index - quarterly data - (2005=100) (NACE Rev.2) (sts_copr_q)
File usage
The following page uses this file:
.PNG&oldid=30797)
.PNG&action=edit&redlink=1)
.PNG&action=history)