_(%25)_Cities16.png)
 (%) Cities16.png&body=Statistics Explained - Cities with the lowest and highest proportion of houses in their total number of dwellings, 2011 (¹) (%) Cities16.png %0A https%3A%2F%2Fec.europa.eu%2Feurostat%2Fstatistics-explained%2Findex.php%3Ftitle%3DFile%3ACities_with_the_lowest_and_highest_proportion_of_houses_in_their_total_number_of_dwellings%2C_2011_%28%25C2%25B9%29_%28%2525%29_Cities16.png)
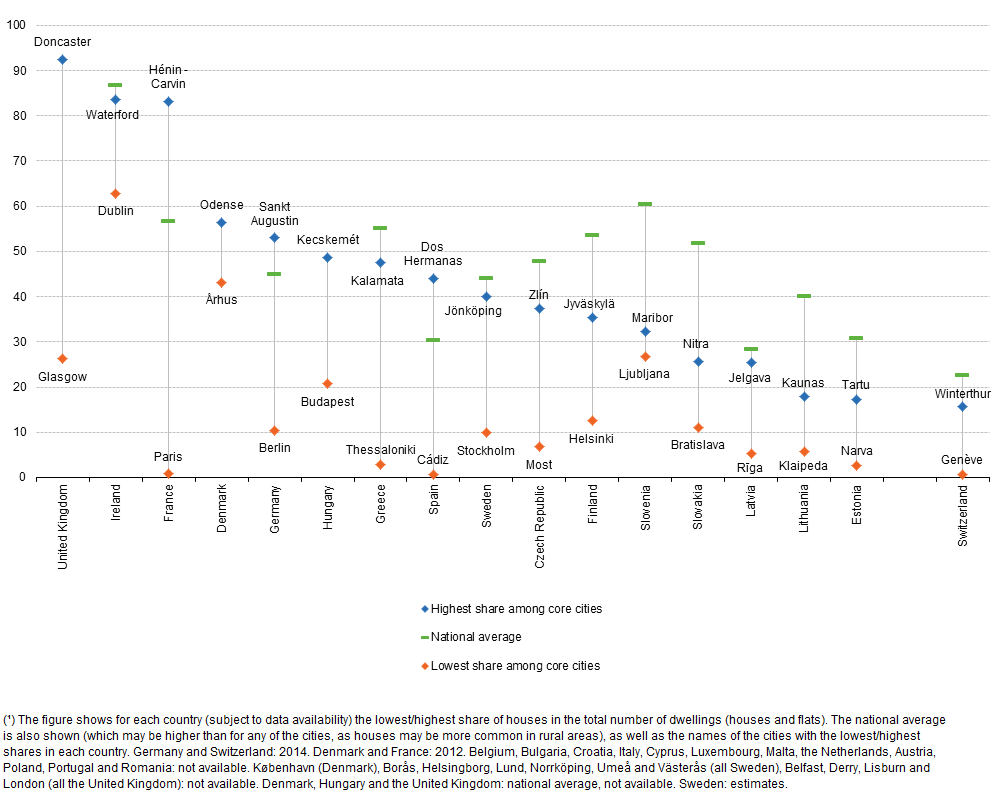
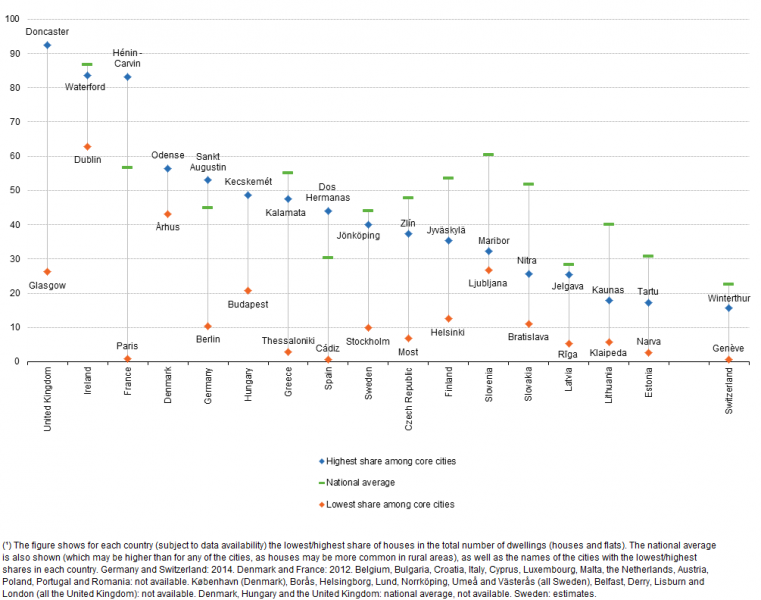
File:Cities with the lowest and highest proportion of houses in their total number of dwellings, 2011 (¹) (%) Cities16.png
Revision as of 11:08, 12 August 2016 by EXT-A-Redpath (talk | contribs) (EXT-A-Redpath uploaded a new version of "File:Cities with the lowest and highest proportion of houses in their total number of dwellings, 2011 (¹) (%) Cities16.png")
_(%25)_Cities16.png)
_(%25)_Cities16.png&diff=prev&oldid=300449)
_(%25)_Cities16.png&direction=prev&oldid=300449)
Size of this preview: 761 × 600 pixels. Other resolutions: 305 × 240 pixels | 1,005 × 792 pixels.
Original file (1,005 × 792 pixels, file size: 47 KB, MIME type: image/png)
File usage
The following page uses this file:
_(%25)_Cities16.png&oldid=300449)
_(%25)_Cities16.png&action=edit&redlink=1)
_(%25)_Cities16.png&action=history)