_(%25_of_commuters)_RYB2016.png)
 (% of commuters) RYB2016.png&body=Statistics Explained - Top 20 regions with the largest number of commuter outflows and their three main destinations, by NUTS 2 regions, 2015 (¹) (% of commuters) RYB2016.png %0A https%3A%2F%2Fec.europa.eu%2Feurostat%2Fstatistics-explained%2Findex.php%3Ftitle%3DFile%3ATop_20_regions_with_the_largest_number_of_commuter_outflows_and_their_three_main_destinations%2C_by_NUTS_2_regions%2C_2015_%28%25C2%25B9%29_%28%2525_of_commuters%29_RYB2016.png)
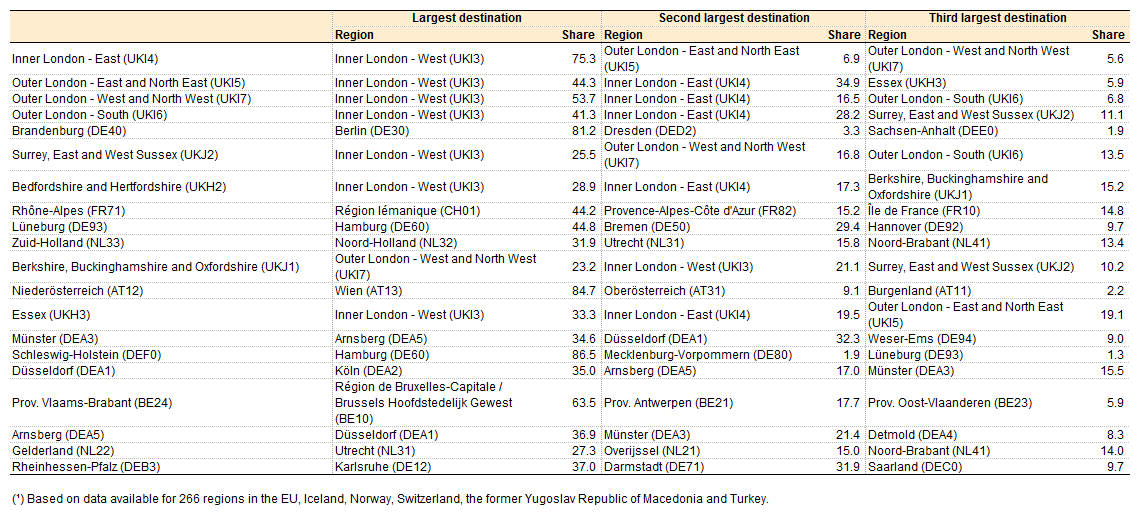
File:Top 20 regions with the largest number of commuter outflows and their three main destinations, by NUTS 2 regions, 2015 (¹) (% of commuters) RYB2016.png
Revision as of 17:23, 5 July 2016 by EXT-A-Redpath (talk | contribs)
Size of this preview: 800 × 366 pixels. Other resolutions: 320 × 147 pixels | 1,142 × 523 pixels.
Original file (1,142 × 523 pixels, file size: 58 KB, MIME type: image/png)
_(%25_of_commuters)_RYB2016.png&oldid=295654)
_(%25_of_commuters)_RYB2016.png)
_(%25_of_commuters)_RYB2016.png&action=edit&redlink=1)
_(%25_of_commuters)_RYB2016.png&action=history)